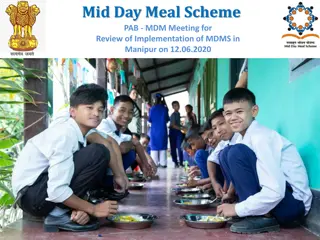
Mid-Day Meal Scheme Implementation in Nagaland: Challenges and Innovations
The Mid-Day Meal Scheme in Nagaland faces challenges such as a decline in enrollment and data entry issues. However, innovative practices like involving the community for nutritious meals and promoting kitchen gardens are being implemented. The state needs to address issues like cash payments to CCHs, data accuracy, and lack of contingency plans to improve scheme effectiveness.
Download Presentation

Please find below an Image/Link to download the presentation.
The content on the website is provided AS IS for your information and personal use only. It may not be sold, licensed, or shared on other websites without obtaining consent from the author.If you encounter any issues during the download, it is possible that the publisher has removed the file from their server.
You are allowed to download the files provided on this website for personal or commercial use, subject to the condition that they are used lawfully. All files are the property of their respective owners.
The content on the website is provided AS IS for your information and personal use only. It may not be sold, licensed, or shared on other websites without obtaining consent from the author.
E N D
Presentation Transcript
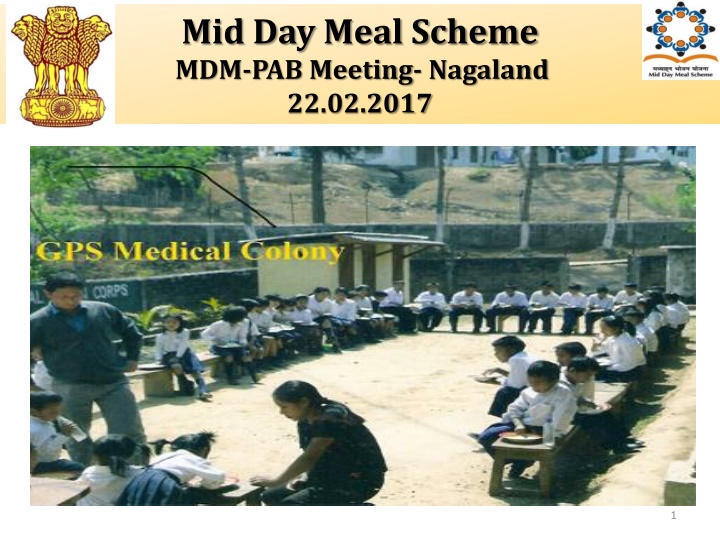
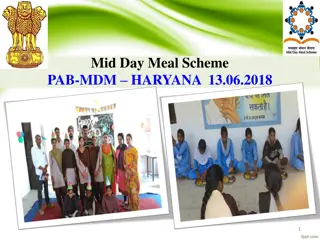
Mid Day Meal Scheme MDM-PAB Meeting- Nagaland 22.02.2017 1
2 Ministry of HRD, Govt. of India
Good practices in Implementation Community contributes seasonal fruits, vegetables as a supplement to the meals served to children. Community is providing dining tables for serving MDM in some of the schools. State has promoted kitchen gardens in 315 schools (approx.) for giving the children more nutritious food. In schools where there are kitchen gardens, children are given the opportunity of proposing their own menu for the meals. To strengthen monitoring of MDM scheme in the blocks, 46 officers have been designated as Block Level Monitoring Officers for all the educational blocks of the State. 3 Ministry of HRD, Govt. of India
Issues Drastic decline in enrolment (1.64 lakh to 1.22 lakh) and coverage of children (1.50 lakh to 1.19 lakh) from 2015-16 to 2016-17. CCHs are being paid through cash only by SMCs. State has not operationalized the Automated Monitoring System for monitoring of MDMS. Poor data entry into MDM MIS web portal (Annual: 70%, Monthly: 59%) Huge mismatch in data of MDM-MIS and AWP&B. Delay in submission of required information by State Govt. (viz. QPRs, information of unspent balance etc.) No contingency plan in place in case of any untoward incident. State has not provided any information on RBSK. 4 Ministry of HRD, Govt. of India
Coverage: Institutions : Existing Vs Achievement (Pry) 1400 1146 1146 1146 1146 No. of Institutions 1200 1000 800 100% 100% 600 400 200 0 2015-16 Existing 2016-17 Achievement Ministry of HRD, Govt. of India 5
Coverage Institutions Existing Vs Achievement (U. Pry with Primary and Upy.) 1000 931 931 930 930 No. of Institutions 750 100% 100% 500 250 0 2015-16 Existing 2016-17 Achievement Ministry of HRD, Govt. of India 6
Coverage : Children (Pry) during last 3 yrs 3 95% 92% 98% 2.06 No. of Children (in lakh) 1.68 1.51 1.64 1.59 1.59 1.50 2 1.22 1.19 0 2014-15 2015-16 2016-17 Enrollment PAB Approval Achievement Ministry of HRD, Govt. of India 7
Coverage : Children (Up. Pry) during last 3 yrs 0.6 0.52 78% 98% No. of Children (in lakh) 95% 0.46 0.41 0.38 0.36 0.38 0.39 0.37 0.36 0.3 0.0 2014-15 Enrollment 2015-16 PAB Approval 2016-17 Achievement 8 Ministry of HRD, Govt. of India
Payment of cost of Food grains to FCI 160 Cost of Food Grain (Rs. In Lakh ) 100% 135.86 140 120 100 74.44 74.44 80 60 40 20 0.00 0 Allocation Bill raised Payment made Pending bills As per FCI there is pendency of Rs, 30 lakhs upto December 2016 Ministry of HRD, Govt. of India 9
FOOD GRAIN : ALLOCATION vs UTILISATION 75 62.89 Quantity in Hundred MTs 45.55 47.98 45.29 50 35.59 29.02 25 64% 72% 74% 0 2014-15 2015-16 2016-17 Allocation Utilisation Ministry of HRD, Govt. of India 10
COOKING COST: ALLOCATION vs UTILISATION 25 22.05 18.00 18.40 20 Rs in Crore 15 11.15 10.98 9.25 10 50% 51% 61% 5 0 2014-15 2015-16 2016-17 ALLOCATION UTILISATION Ministry of HRD, Govt. of India 11
Engagement of Cook-cum-helpers Primary + Upper Primary 6000 5057 4643 No. of CCH 3000 92% 0 PAB Approval Engaged by State Ministry of HRD, Govt. of India 12
Payment of Honorarium to CCH 10 80% 0% Rs. In Crore 5.05 5.05 4.02 5 0.00 0 2015-16 2016-17 Allocation Payment to CCH Ministry of HRD, Govt. of India 13
MME : ALLOCATION vs UTILISATION 60 53.35 43.11 42.67 54% 20% 59% Rs in Lakh 28.82 25.5 30 8.49 0 2014-15 2015-16 2016-17 ALLOCATION UTILISATION . 67% institutions have been inspected during 2016-17. 14 Ministry of HRD, Govt. of India
Transportation Assistance : Allocation vs Utilization 2 56% 64% 41% 1.56 1.19 1.13 Rs in Crore 0.88 1 0.72 0.49 0 2014-15 2015-16 2016-17 ALLOCATION UTILISATION Ministry of HRD, Govt. of India 15
Construction of Kitchen cum Stores Total Sanctioned : 2223 Kitchen Cum Stores 100% 100% 100% Progress (in %) 50% 2223 0% 0% 0% 0% 0% Constructed In Progress Yet to be started Ministry of HRD, Govt. of India 16
Achievement up to 2016-17 (Kitchen Devices) 120% 100% 100% 80% Progress (in %) 40% 0% 0% 0% 0% 0% Procured In Progress Yet to be procured Financial Physical Total Sanctioned : 4547 (2751 new+1796 replacement) units of Kitchen Devices Ministry of HRD, Govt. of India 17
Summary of performance - Physical 100% 100% 98% 98% 1 Percentage % 0.5 0 Covg_Pry Covg_Upr W_Day Institution Ministry of HRD, Govt. of India 18
Summary of performance Financial 100% 1 80% Percentage % 64% 64% 61% 59% 0.5 0 Food grain Payment to FCI Cooking cost Hon. to CCH T. A. MME Ministry of HRD, Govt. of India 19
Comparison of data: MIS vs AWP&B Institutions 100% 100% LPG Working Days 84% 100% 73% 94% 50% 38% Toilet Facility Children 78% 98% 95% 9% 37% 59% 0% 45% Drinking water CCH engaged 64% 60% 61% 92% >100% Food grains CCH Hon. 80% >100% Cooking Cost MIS AWP&B 20
Three Year scorecard at a glance Institution FY-2016-17 6.0 DW Children 9.8 10.0 9.5 Toilet Working Days Monthly data entry Foodgrain Utilz 5.9 6.4 5.0 Annual data entry Payment to FCI 7.0 10.0 0.0 6.0 6.7 Inspection Fund Flow 6.1 School Health Cooking Cost TA Hon to CCH 8.0 6.4 Kitchen Devices MME 5.9 10.0 10.0 Kitchen shed FY : 2015-16 FY-2014-15 10 Institutions Toilet Institutions Toilet 10 9.5 8.9 Children 10 8.8 Children Working FG Utilsation 9.5 10 6 7 Drinking Water Working Days Drinking 5.6 Monthly 2 10 8 6 Monthly daya FG Utilsation 7.2 7.4 5 4 9.1 10 Annual Data Payment to FCI Annual Payment to 2 4.9 7.1 0 0 1 1.6 Inspection Fund Flow Inspection Fund Flow 3.0 6.4 School Cooking Cost Hon.CCH MME 5.0 School Health Cooking Cost 5.9 5.1 2.2 TA 5.6 6.0 TA Hon.CCH MME 0.0 4.1 KD KD 2.0 5.4 9.6 KS 10 KS 21 10 10
Analysis of States Proposal for 2017-18 Ministry of HRD, Govt. of India 22
Proposal for 2017-18 : Children (Primary) 1.6 1.51 No. of children (in lakhs) 1.19 1.20 1.21 1.17 1.22 1.22 1.19 PAB Approval 2016-17 Availed MDM (9 months) Proposed by State Recommendation Availed MDM in Q-2 Availed MDM in Q-3 Availed MDM in Q-1 0.8 Enrolment 0.0 Ministry of HRD, Govt. of India 23
Proposal for 2017-18: Children (Upper Primary) 1 0.38 0.37 0.38 0.37 0.37 0.38 0.37 0.36 No. of children (in Lakhs) PAB Approval for 2016-17 Availed MDM (9 months) Proposed by State Recommendation Availed MDM in Q-2 Availed MDM in Q-3 Availed MDN in Q-1 0 Enrolment 0 Ministry of HRD, Govt. of India 24
Proposals and Recommendations Component PAB Approval 2016-17 Children (Pry) 150539 Children (U Pry) 35504 S. No 1 2 Proposal for 2017-18 Recommendation 121634 36858 119434 36220 3 Children (STC) 963 957 957 4 Working Days Pry_220 Upry_220 NCLP_312 0 Pry_220 Upry_220 NCLP_312 0 Pry_220 Upry_220 NCLP_312 0 5 Kitchen cum Store 6 Cook cum Helpers 5057 4643 4643 (Reduction of 414) Nil 7 Kitchen Devices (New) Kitchen Devices (Replacement) MME (Rs. In lakh) Notional Requirement of Central Assistance (Rs. In lakh) Nil Nil 8 Nil 541 541 9 43.11 37.21 37.21 10 2402.81 2188.80 2131.59 25
Thank You Ministry of HRD, Govt. of India 26
