Methodological Considerations in Estimating CO2 Emissions Using EFS/LCF
Various studies have utilized the EFS/LCF in the UK to estimate household emissions and policy impacts. This involves converting expenditures into emissions, which presents methodological challenges such as infrequent purchases and variations in data sources. The comparison of household CO2 emissions from 2006 to 2009 shows variations in average total CO2, median, mean, and standard deviations across different methods of estimation.
Download Presentation

Please find below an Image/Link to download the presentation.
The content on the website is provided AS IS for your information and personal use only. It may not be sold, licensed, or shared on other websites without obtaining consent from the author.If you encounter any issues during the download, it is possible that the publisher has removed the file from their server.
You are allowed to download the files provided on this website for personal or commercial use, subject to the condition that they are used lawfully. All files are the property of their respective owners.
The content on the website is provided AS IS for your information and personal use only. It may not be sold, licensed, or shared on other websites without obtaining consent from the author.
E N D
Presentation Transcript
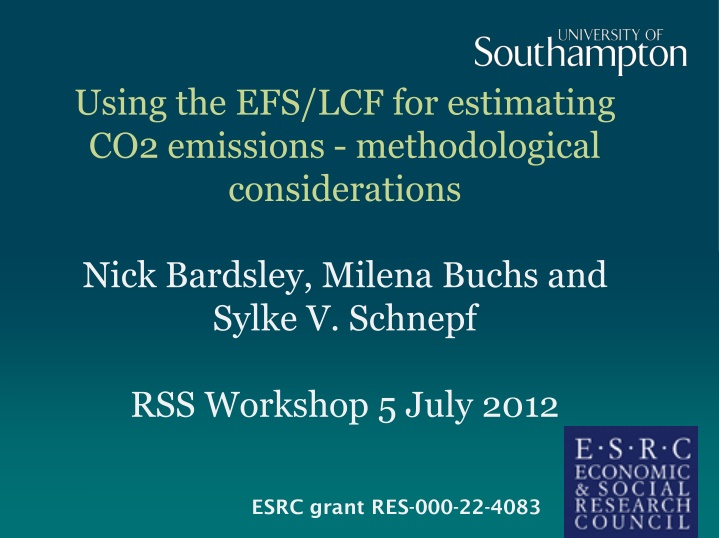
Using the EFS/LCF for estimating CO2 emissions - methodological considerations Nick Bardsley, Milena Buchs and Sylke V. Schnepf RSS Workshop 5 July 2012 ESRC grant RES-000-22-4083
Background A range of studies have used the EFS/LCF (UK) to estimate household emissions or policy impacts E.g. Dresner/Ekins 2006; DEFRA 2008; Druckman/Jackson 2008, 2009; Baiocchi 2010; Preston et al. 2010, Fahmy et al 2011; Gough et al. 2011; Cross-section data particularly important for examining the role of socio-economic factors and distributional issues But so far no detailed discussion of methodological problems in the literature 2
Methodological issues Converting expenditure into emissions and limitations Comparing different methods of conversion Infrequency of purchase Need to discuss impact on estimation of total emissions, mean, median, measures of variance, regression coefficients, standard errors 3
Converting expenditure to emissions Our dataset: merged the Expenditure and Food Survey 2006 and 2007 with the Living Costs and Food Survey 2008 and 2009; total household sample size 24,446 How can we convert expenditure into CO2 emissions? Use external price statistics (home energy, motor fuels); passenger km (public transport) to estimate units of consumption. Apply DECC conversion factors to estimate CO2 Use the Resources and Energy Analysis database (REAP) from the University of York/SEI to estimate CO2/ expenditure for 56 COICOP consumption categories We used a combination of both and also compared them 4
Limitations Expenditure consumption/emissions E.g. home energy: no information on provider, tariff, etc.; price of transport tickets not strictly related to km travelled External price data can account for some variation but are still relatively aggregated Product quality problem high income hh buy more expensive products overestimation of emissions likely (see Girod/Haan 2010) 5
Comparison of household CO2 emissions, 2006-2009 average Total UK CO2 (mio tonnes) Median (tonnes) Mean (se) (tonnes) Stand. Dev. 90/10 ratio Mixed 535 17.47 21.05 (0.04) 16.78 6.48 Reap 538 17.44 21.14 (0.05) 17.36 6.53 Expendit ure- based 561 18.09 22.06 (0 .16) 17.85 7.31 DECC 527 20.76 6
Comparing estimates UK CO2 (mio t) Stand. Dev. Median (t) Mean (se) (t) 271 8.69 10.67 (0.08) 9.25 Indirect (mixed) Indirect (reap) 279 8.99 10.98 (0.08) 9.38 492 15.72 19.35 (0.15) 16.36 Indirect (exp) Home energy (mixed) Home energy (reap) 130 4.48 5.11 (0.03) 3.98 132 4.53 5.17 (0.03) 4.01 Home energy (exp) 22 0.77 0.86 (0.01) 0.61 Transport (mix) 134 3.07 5.27 (0.07) 8.98 Transport (reap) 127 2.69 4.98 (0.07) 9.8 7 Transport (exp) 46.9 1.85 (0.02) 1.05 2.66
Infrequency of purchase Infrequency of purchase Very common problem but little discussion in lit on emissions EFS/LCF collects data through diaries and a hh survey for less frequent expenditures Expenditure during diary window is likely to over- or underrepresent consumption for a range of items In theory, zero expenditure and higher-than- consumption expenditure cancel out Totals, means and regression coefficients unaffected but percentiles, measures of variance and standard errors inflated 8
Exploring the extent of infrequency of purchase Home energy (5.8% zero) Flights and public transport (59%/98.7% and 50.2% zero) Motor fuels (36% zeros) (comparison with NTS) Can we distinguish IoP from true zeros? 9
Home energy Home energy: prepayments for electricity and gas are collected through the diary, in contrast to all other payment methods Home energy expenditure for oil, wood, coal, etc. are also collected through the diary, but only make up ca. 2% of sample 8.08% and 7.03% of households have zero electricity or gas expenditure 48% and 51% of households who pre-pay for electricity and gas have zero expenditure 31% of households in the lowest income quartile are on prepayment meters 10
Zero public transport and flights, 2007 EFS diary EFS survey NTS survey UK flights 99.67 93.98 84.23 Flights abroad 99.07 58.08 n/a Bus/coach 84.89 n/a 24.19 Train/tube 89.29 n/a 36.94 Taxi 88.36 n/a 28.68 Percentage of households in sample who have zero expenditure (EFS diary)/zero usage (NTS survey) in 2007 11
Motor fuels 18.2 % of households who have a vehicle do not have an expenditure on motor fuels in the EFS/LCF (2-week diary) We use the National Travel Survey (NTS) to cross check: In the NTS, 39% of households who have a vehicle did not purchase motor fuel during the 1-week diary period The NTS also records mileage driven through a survey Only 0.1% of households who have a vehicle recorded zero miles travelled by car 12
Range Distortion from Infrequency of Purchase 60 Range 0-60,000kg Median: 2,500kg CO2 Range 0-60,000kg Median: 2,500kg CO2 CoV: 1.1 Range 0-100,000kg Median: 0kg CO2 Range 0-100,000kg Median: 0kg CO2 CoV: 1.6 40 Percent Percent 30 20 20 10 0 0 0 5000 10000 15000 0 5000 10000 15000 National Travel Survey diary data total household CO2 from est ann mileage National Travel Survey interviewdata total household CO2 from litres of fuel bought in diary week
False motor fuel zeros Zero Fuel Purchases - NTS Diary 14,000.00 12,000.00 10,000.00 Count 8,000.00 zeros 6,000.00 'false' zeroes 4,000.00 observations 2,000.00 0.00 1 2 3 4 5 Income Quintile 14
False motor fuel zeros Zero Fuel Purchases - LCF Diary 6,000.00 5,000.00 4,000.00 Count zeros 3,000.00 'false' zeroes 2,000.00 observations 1,000.00 0.00 1 2 3 4 5 Income Quintile 15
Conclusions Using expenditure surveys like the EFS/LCF has limitations for estimating CO2 emissions but currently the only available option for examining the distribution of hh emissions and role of hh characteristics Infrequency of purchase is unlikely to affect estimates for total and mean emissions but likely to affect order statistics and measures of variance which are important in the analysis of distribution/inequality Improved data collection required for transport and some areas of home energy 16
http://t3.gstatic.com/images?q=tbn:ANd9GcT0Q80_foOiNjFonpy-8gnuIRUGVDLNM0qk-HBTnz2wa33Y3gZ7http://t3.gstatic.com/images?q=tbn:ANd9GcT0Q80_foOiNjFonpy-8gnuIRUGVDLNM0qk-HBTnz2wa33Y3gZ7 Limitations: product quality and price 2150 3.6 3.4 Average daily kcal pp 2100 Average daily expenditure pp, 3.2 3 2050 2.8 2000 2.6 2.4 1950 Average daily kcal Daily food expenditure ( ) 2.2 1900 2 1 2 Income deciles, disposable income 3 4 5 6 7 8 9 10 17 Source: Defra 2011 http://www.defra.gov.uk/statistics/foodfarm/food/familyfood/datasets/, authors calculations LCFS 2006 to 2009
