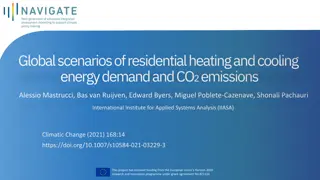
CO2 Emissions and Global Value Chains: Trends in Decoupling and Regional Impacts
The discussion focuses on the relationship between CO2 emissions and Global Value Chains (GVCs) from 1990 to 2015, exploring how GVC participation can aid in decoupling. It covers the environmental implications of GVCs, such as the effects on CO2 footprints, trade patterns, and emission intensities across regions. Insights from reports on sustaining GVCs and the challenges of achieving net-zero carbon in supply chains are also analyzed.

Download Presentation

Please find below an Image/Link to download the presentation.
The content on the website is provided AS IS for your information and personal use only. It may not be sold, licensed, or shared on other websites without obtaining consent from the author.If you encounter any issues during the download, it is possible that the publisher has removed the file from their server.
You are allowed to download the files provided on this website for personal or commercial use, subject to the condition that they are used lawfully. All files are the property of their respective owners.
The content on the website is provided AS IS for your information and personal use only. It may not be sold, licensed, or shared on other websites without obtaining consent from the author.
E N D
Presentation Transcript
CO2 emissions: Can GVC participation help decoupling? (regional trends: 1990-2015) Jaime de Melo and Jean-Marc Solleder Comments for Special Session on Sustaining Global Value Chains 28th. ERF Annual conferenceJaime de Melo, Jean-Marc Solleder, March 24: 15:00-16:30
ADB report on Sustaining GVCs Comprehensive report on GVC landscape with focus on importance of infrastructure and transport. Complements WB WDR(2020) where focus was on moving up the GVC ladder (commodities, ltd. mfg., adv. Mfg. & services, innovative actirivites). Useful distinction between place-based (SEZs) and sector-oriented industrial policies to help focus on trade costs. Focus welcome. GVCs have shortened (2008 crisis+ COVID) + uncertainy trade-related tensions + ongoing digitalization (+conflicts). GVC average length has shrunk by 50 km per year over 2012-18 (Miroudot and Nordstrom, 2020). Sustainability of GVCs requires moving toward net zero carbon. Patterns of C02 emissions intensities (direct and indirect) across supply chains: characteristics (upstreamness), trends across regions to complement ADB report List of countries and extra tables in annex
G GV VC Cs s a ar re e m mixed ixed blessing for the blessing for the envi envir ro on nm me en nt t: : C C02 02 footprin footprint t i imp mpl li ic ca at tions ions Negative side Scale effects of trade and growth More shipping across countries and more waste in aggregate (e.g. In electronics via higher rate of technological innovation or plastics). ADB estimates 2.1 gigaton CO2e associated with international trade Industries might migrate to environmentally lax jurisdictions (pollution haven effect from falling trade costs and tighter environmental regulations) Positive side knowledge flows across might lead to adoption of environmentally innovative products and technologies (Porter pollution halo hypothesis) Lead firms in GVCs have brand names to protect in relational GVCs. Environmental impacts borne upstream while value created downstream. Lead firms can reduce scope 1 and 2 emissions from upstream suppliers in other jurisdictions. Patterns of C02 emissions intensities (direct and indirect) across supply chains: characteristics (upstreamness), trends across regions to complement ADB report
Direct and Indirect CO2 emissions by region (emission intensity: kg/ ; output-weighted averages) Number of countries per region Africa (51) Americas (31) Asia (47) Europe (43) Oceania (8) Downward trend for CO2e(not all GHGs) across all regions. Much higher intensity in Africa and Asia. Higher indirect intensity in Asia than Africa
Decoupling? (countries below 45 line) Vertical and horizontal lines show average growth rates Africa Decoupling in Africa in second period Larger number of countries below 450 line Decoupling in Asia in both periods. On average (intersection below 450 line) Number of countries below 450 line Asia
Upstreamness/Downstreamness (output weighted) Upstreamness (U) measures how far direct plus all indirect sector sales, Y, are from sales to final consumers, F. Sales are to intermediates, Z and final, i.e. Y Z+F. Second round sales to intermediates (Z2)from first-round intermediates production. U measure is 1+ output weighted sales to other (downstream) sectors U 1 U=1+F/Y +2x(Z1/Y )+3x (Z2/Y) +.... (1) See equation (5) in Antras and Chor (2018) U=1 if all sales go to final demand. Larger shares sales to other sectors associated with higher U values. Large U values indicate high upstream position (far away from sales to consumers) from final use. Downstreamness (D). replace Y with VA in (1) gives an estimate of the average number of production stages embodied in a sector s output. D 1. Gross -output weighted-averages of U and D across country-industries are equivalent. See list of countries per region in annex. Figure shows all regions are moving upstream (i.e. Sectors selling less to final consumers) except for Oceania In other words, world production is becoming more roundabout, or greater amount Large sustained rise in Asia ( factory Asia ) Low value in Oceania (small countries ++Australia and NZ distant from main trade partners). Both are obstacles to scale economies and to participation in GVCs.
Comparing Distribution of CO2 intensity of production and exports (by quartile of CO2e intensity by region for 2015; direct intensity) Africa Asia Share of high CO2 intensity exports higher in Africa (11%) than in Asia (3%) but higher export share in Asia in third quartile
Some Correlates of CO2 emissions Log(length) Log(pos) Log(length)# Log(pos) Log(Output) Constant Observations (1) (2) World (3) (4) (5) Africa (6) (7) (8) Asia (9) Log(DEI) Log(DEI) Log(DEI) Log(DEI) Log(DEI) Log(DEI) Log(DEI) Log(DEI) Log(DEI) 0.525*** 0.731*** 0.715*** 0.384*** 0.681*** (0.0135) (0.0158) (0.0153) (0.0271) (0.0284) -0.770*** -1.036*** -0.710*** -1.180*** -1.669*** (0.00919) (0.0130) (0.0133) (0.0185) (0.0296) 0.151*** 0.156*** 0.282*** (0.00518) (0.00499) (0.0132) -0.341*** (0.00327) -2.876*** -3.161*** -1.565*** -3.110*** -3.517*** (0.0192) (0.0223) (0.0257) (0.0362) (0.0380) 448371 448371 448371 118921 118921 Year, Sector, country country country country country 0.622 0.622 0.637 0.850 0.851 0.625*** (0.0251) 0.273*** (0.0259) 0.349*** (0.0299) 0.407*** (0.0298) -0.817*** (0.0296) 0.244*** (0.0117) -0.686*** (0.00777) -0.936*** (0.0424) 118921 Year, Sector, country 0.873 -0.923*** (0.0178) -1.979*** (0.0375) 117052 Year, Sector, country 0.704 -1.016*** (0.0226) 0.0523*** 0.0835*** (0.00820) (0.00802) -2.084*** (0.0429) 117052 Year, Sector, country 0.704 -0.721*** (0.0238) -0.345*** (0.00677) -0.506*** (0.0487) 117052 Year, Sector, country 0.716 Year, Sector, Year, Sector, Year, Sector, Year, Sector, FE Adjusted R2 Standard errors in parentheses. *p < 0.1, **p < 0.05, ***p < 0.01 Notes : DEI: Direct Emission Intensity. Length= U +D; POS =U/D A larger value of Pos means more upstream.
Next steps Stylized patterns : Some decoupling across regions; High CO2 intensity of export basket in Africa; Correlates of CO2 intensity of activities (upstream, GVC length, etc...) Exploit RMRIO granularity for Policy Asia fully integrated into GVCs. Policy issue is to detect potential comparative advantage in low CO2e activities and to incentivize them Africa still to reap benefits of climbing up GVC ladder. Uncover a low CO2 intensity path. Use proximity metrics to explore product space and find clean products close to those currently exported.
References Antras, P., D. Chor, T. Fally, R. Hillberry (2012) Measuring Upstreamness of Production and Trade Flows , American Economic Review, Papers and Proceedings, 102( 3), 412-16 Antras, P., D. Chor (2018) On the measurement of Upstreamness and Downstreamness in Global Value Chains , NBER WP #24185 Baldwin, R., and R. Freeman (2021) Risks and global Supply chains: What we know and what we need to know , NBER WP#29444 Cabernard, L. and S. Pfister (2021) A highly resolved MRIO database for analysing environmental footprints and Green economy Progress , Science on the Total Environment, 755 Lenzen, M., D. Moran, K. Kanemoto, A. Gesckhe (2013), Building EORA: A Global multi-region input-output database at high country and sector resolution , Economic Research Systems, 25(1), 20-49 Miroudot, S. and H. Nordstrom (2020) Made in the World? Glvoal Value Chains in the Midst of Rising Protectionism , Review of Industrial Organization, 57(2), 195-222 World Bank, 2020. Trading for Development in the Age of Global Value Chains, World Development Report, https://www.worldbank.org/en/publication/wdr2020
RMRIO countries : Africa Algeria Angola Benin Botswana Burkina Faso Burundi Cameroon Cape Verde Central African Republic Chad Congo Cote d'Ivoire Democratic Republic of Congo Djibouti Egypt Eritrea Ethiopia Gabon Gambia Ghana Guinea Kenya Lesotho Liberia Libya Madagascar Malawi Mali Mauritania Mauritius Morocco Mozambique Namibia Niger Nigeria Rwanda Sao Tome and Principe Senegal Seychelles Sierra Leone Somalia South Africa South Sudan Sudan Swaziland Tanzania Togo Tunisia Uganda Zambia Zimbabwe
RMRIO countries : Americas Antigua and Barbuda Argentina Aruba Bahamas Barbados Belize Bermuda Bolivia Brazil British Virgin Islands Canada Cayman Islands Chile Colombia Costa Rica Cuba Dominican Republic Ecuador El Salvador Greenland Guatemala Guyana Haiti Honduras Jamaica Mexico Nicaragua Panama Paraguay Peru Suriname Trinidad and Tobago United States Uruguay Venezuela
RMRIO countries : Asia Afghanistan Armenia Azerbaijan Bahrain Bangladesh Bhutan Brunei Cambodia China Cyprus Georgia India Indonesia Iran Iraq Israel Japan Jordan Kazakhstan Kuwait Kyrgyz Republic Laos Lebanon Malaysia Maldives Mongolia Myanmar Nepal North Korea Oman Pakistan Palestine Philippines Qatar SaudiArabia Singapore South Korea Sri Lanka Syria Tajikistan Thailand Turkey Turkmenistan United Arab Emirates Uzbekistan Vietnam Yemen
RMRIO countries : Europe Albania Andorra Austria Belarus Belgium Bosnia and Herzegovina Bulgaria Croatia Czech Republic Denmark Estonia Finland France Germany Greece Hungary Iceland Ireland Italy Latvia Liechtenstein Lithuania Luxembourg Macedonia Malta Moldova Monaco Montenegro Netherlands Norway Poland Portugal Romania Russia San Marino Slovak Republic Slovenia Spain Sweden Switzerland Ukraine United Kingdom Yugoslavia
RMRIO countries : Oceania Australia Fiji French Polynesia New Caledonia New Zealand Papua New Guinea Samoa Vanuatu
D Da at ta a b ba as se: e: hi hig gh h g gr ra an nu ul la ari rit ty y Estimates from new extensive data base with RMRIO (for Resolved MRIO) that merges EORA temporal and country coverage (Lenzen et al. (2015) coupled with EXIOBASE sectoral data. EORA s emissions sourced from EDGAR but RMRIO aggregate of CO2, CH4, N2O, hydrofluorocarbon and perfluorinated compound, into a single measure in CO2 equivalent (CO2e). RMRIO (Cabernard and Pfister(2021).Data for 193(J-countries) and 163 (S-sectors) over the period 1995-2015. Estimates of CO2 footprint in GVCs bases on 193 countries and 163 sectors for a potential of Zijrs = (163*193)2 109 input purchases across country-industry pairs. High granularity data base. 22% of lines at sector level have 0 total emissions reflecting that some sectors are not be produced in some countries. Comparison EDGAR- RMRIO shows similar footprint estimates from the two CO2 databases.
top 5 and bottom 5 CO2 emitters (intensity and corresponding share of GDP) Africa Asia
Carbon intensity of revealed Comparative advantage (RCA>1) (by quartile and by decile of CO2 intensity) Explore further CO2 intensity of patterns of comparative advantage


")


")