Massachusetts Community College Performance-Based Funding Model
Massachusetts Department of Higher Education has developed a Performance-Based Funding Model for Community Colleges to address funding inequities, allocate funds based on institutional performance, and support workforce readiness. The model was created in consultation with stakeholders and is aimed at enhancing the role of Community Colleges in the state's economy. The establishment of a Task Force further ensures continuous analysis and development of the funding formula.
Uploaded on Sep 29, 2024 | 2 Views
Download Presentation

Please find below an Image/Link to download the presentation.
The content on the website is provided AS IS for your information and personal use only. It may not be sold, licensed, or shared on other websites without obtaining consent from the author.If you encounter any issues during the download, it is possible that the publisher has removed the file from their server.
You are allowed to download the files provided on this website for personal or commercial use, subject to the condition that they are used lawfully. All files are the property of their respective owners.
The content on the website is provided AS IS for your information and personal use only. It may not be sold, licensed, or shared on other websites without obtaining consent from the author.
E N D
Presentation Transcript
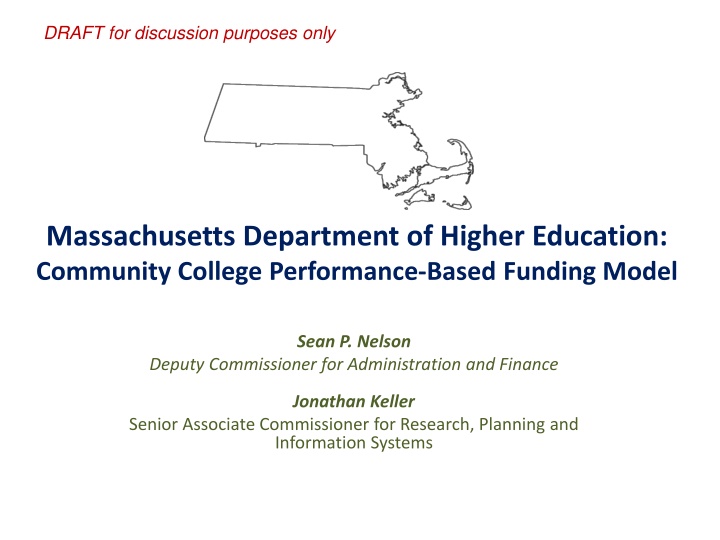
DRAFT for discussion purposes only Massachusetts Department of Higher Education: Community College Performance-Based Funding Model Sean P. Nelson Deputy Commissioner for Administration and Finance Jonathan Keller Senior Associate Commissioner for Research, Planning and Information Systems
Presentation Topics I. Background The Charge The Principles The Process The Funding II. Formula The Basics of the Formula The Dashboard Detail The FY15 Budget and Next Steps
Community College Funding Formula: Legislative Charge Section 171 of the FY13 General Appropriations Act (GAA) states: The commissioner of higher education, in consultation with the presidents of the community colleges and representatives of the Massachusetts Teachers Association, shall develop a funding formula for the community colleges which incorporates the allocation of appropriations to the individual community colleges based, in part, on performance. Additionally, MGL, Chapter 15A, Section 15B stipulates that: Boards of trustees in each segment of the higher education system shall prepare their budget request in accordance with funding formulas. The board of higher education shall develop the formulas for the institutions within the state university and community college segments in consultation with the boards and trustees and the secretary.
Community College Funding Formula: Why? The funding formula was implemented to address three essential issues: The large inequities in per student funding that have developed among the colleges over time as their annual appropriations have risen by identical percentages while their growth rates have varied significantly Lack of a mechanism for allocating funds in relation to aspects of institutional performance that reflect statewide higher education goals Governor/Legislature emphasis on the role of Community Colleges in preparing students for jobs in the state s rapidly evolving economy
Community College Funding Formula: Establishing a Task Force Immediately following the passage of the FY13 budget, Commissioner Freeland established a Task Force on the Community College Funding Formula To aid in the analysis and development of the formula, the Department of Higher Education retained the National Center for Higher Education Management Systems (NCHEMS) to assist the Taskforce in the design and development of the funding formula. Task Force held four meetings between July and December 2012 to confer on the elements of the Formula including: Base and Performance funding metrics Proportion/Share allocated to Base vs Funding Weights to be applied to each individual metric Limits regarding annual institutional funding losses or gains After the Task Force reached a general consensus on a formula, DHE drafted the Task Force Report and submitted it to each campus president for comment. The Task Force Report was also shared with other key stakeholders including: EOE, Governor s Office, Labor and Workforce Development, Housing and Economic Development, the chairs of Senate and House Committees on Ways and Means, and the co-chairs of the Joint Committee on Higher Education.
Community College Funding Formula: Source of Funding The formula reallocated the total amount appropriated to the campuses through the individual line-items in the FY13 state budget A total of $208.2M The FY14 collective bargaining costs that were added to the campus line- items were not subject to the formula In FY14, an additional $20M of funding was appropriated in a new line-item for the community colleges This funding was in addition to the individual campus line-item appropriation All amounts were determined by the formula and communicated to the legislature by the DHE. All Funds were earmarked, by campus, in the appropriation and transferred to the institutions In FY14, a total of $228.2M was reallocated using the formula methodology
FY14 Funding Mechanics Line-item Institution Base $20M Allocated through 7100-4000 Total FY14 Allocation Appropriation 7502-0100Berkshire $ 8,569,374 $ 1,094,424 $ 9,663,798 Community College 7503-0100Bristol Community College 7518-0100Bunker Hill Community College 7504-0100Cape Cod Community College $ 15,224,011 $ 2,940,286 $ 18,164,297 $ 19,194,201 $ 2,282,913 $ 21,477,114 $ 10,536,601 $ 343,833 $ 10,880,434 7100-4000Massachusetts Community Colleges $ 20,000,000 7100-4000 Massachusetts Community Colleges For funding to community college campuses in the Commonwealth; provided, that funds shall be expended for the continued implementation of community college reform, for continued initiatives to strengthen the connections between the colleges, local businesses and regional workforce investment boards and to improve workforce training at the colleges; provided further, that funding shall be allocated among the campuses using the formula developed by the commissioner of higher education in consultation with the secretaries of education, labor and workforce development and housing and economic development; provided further, that the allocation of funds shall be approved by the board of higher education; provided further, that in developing the allocation among campuses, the commissioner shall ensure that no campus receives less in fiscal year 2014 than in fiscal year 2013; and provided further, not less than the following amounts shall be made available to the respective institutions named herein: (a) $1,091,424 to Berkshire Community College; (b) $2,940,286 to Bristol Community College; (c) $2,282,913 to Bunker Hill Community College; (d) $343,833 to Cape Cod Community College; (e) $1,150,565 to Greenfield Community College; (f) $1,086,747 to Holyoke Community College; (g) $1,937,548 to Massachusetts Bay Community College; (h) $608,165 to Massasoit Community College; (i) $1,862,410 to Middlesex Community College; (j) $1,076,995 to Mount Wachusett Community College; (k) $617,047 to North Shore Community College; (l) $570,697 to Northern Essex Community College; (m) $3,353,379 to Quinsigamond Community College; (n) $340,527 to Roxbury Community College; and (o) $737,464 to Springfield Technical Community College
Funding Formula Dashboard Stage One: Set Funding Allocations New Funding Allocations FY14 No New Funding Level - No Stop Loss New Funding Level - With Stop Loss Allocate new money directly to Performance? Past Amounts $208,154,311 Total State and Local Appropriations Massachusetts Public Community Colleges Difference $ (+/-) between Stop Loss and FY13 GAA % Difference in Funding 2013 Total Allocation After Stop Loss Adjustment Percentage Difference in Funding from FY13 Base Allocation ($) Performance Allocation ($) Cost of Operation Subsidy ($) Total Allocation FY13 Funding Amount 50% $80,327,156 Base Funding Allocation Amount Allocated: 50% $80,327,156 Berkshire Community College $7,988,207 $ 2,112,318 $ 3,330,594 $ 4,500,000 $ 9,942,912 24.5% $ 9,207,281 $ 1,219,074 15.3% Performance Funding Allocation Amount Allocated: $20,000,000 Bristol Community College $13,885,391 $ 6,820,622 $ 7,076,763 $ 4,500,000 $ 18,397,385 32.5% $ 16,699,347 $ 2,813,956 20.3% Ancillary Budget Amount Amount Allocated: Stage Two: Define Weight and Multiplier Values for Performance Allocations Bunker Hill Community College $17,496,631 $ 8,912,763 $ 7,603,525 $ 4,500,000 $ 21,016,288 20.1% $ 19,691,704 $ 2,195,073 12.5% College Enrollment Variables College Completion Variables Alignment Variables Cape Cod Community College $9,823,796 $ 3,224,452 $ 2,444,272 $ 4,500,000 $ 10,168,724 3.5% $ 10,167,629 $ 343,833 3.5% 1.0 10% Greenfield Community College $7,805,889 $ 2,151,049 $ 3,146,823 $ 4,500,000 $ 9,797,872 25.5% $ 9,048,211 $ 1,242,322 15.9% Liberal Arts Certificate Completion Weight 1.5 15% 1.50 Holyoke Community College $16,074,594 $ 5,969,313 $ 7,197,649 $ 4,500,000 $ 17,666,962 9.9% $ 17,067,692 $ 993,098 6.2% Physical, Bio, Social Science Associate Completion Weight At-Risk Multiplier: Pell 2.0 5% 1.30 Massachusetts Bay Community College $11,859,106 $ 4,470,668 $ 6,223,780 $ 4,500,000 $ 15,194,448 28.1% $ 13,939,229 $ 2,080,123 17.5% Math and Computer Science Transfers Above 24 SCH Weight Priority Certificate Multiplier 1.5 5% 1.30 Massasoit Community College $17,376,154 $ 6,702,109 $ 5,341,321 $ 4,500,000 $ 16,543,430 -4.8% $ 17,984,319 $ 608,165 3.5% Visual & Performing Arts 30 Credits Hours Weight Priority Associate Multiplier 1.5 7% Define Stop-Loss / Alt. Minimum Middlesex Community College $17,121,183 $ 8,213,614 $ 7,471,748 $ 4,500,000 $ 20,185,362 17.9% $ 19,032,193 $ 1,911,010 11.2% Pre-Education Completions: English Weight 2.0 8% 3.5% Mount Wachusett Community College $11,007,508 $ 4,743,484 $ 3,445,542 $ 4,500,000 $ 12,689,027 15.3% $ 12,056,206 $ 1,048,698 9.5% Engineering / Architecture Completions: Math Weight 1.5 5% Define Stop-Gain / Alt. Maximum North Shore Community College $17,629,906 $ 6,369,881 $ 6,444,258 $ 4,500,000 $ 17,314,139 -1.8% $ 18,246,953 $ 617,047 3.5% Developmental Education Awards per 100 FTE 2.5 45% 100.0% Northern Essex Community College $16,305,635 $ 5,380,009 $ 6,239,967 $ 4,500,000 $ 16,119,976 -1.1% $ 16,876,332 $ 570,697 3.5% Trades ATD Success Rate (3 Year Average) All weight percentages must equal 100% 2.0 100% Quinsigamond Community College $12,980,557 $ 7,331,544 $ 6,406,535 $ 4,500,000 $ 18,238,079 40.5% $ 16,259,469 $ 3,278,912 25.3% Technologies 2.0 Roxbury Community College $9,729,356 $ 2,178,260 $ 1,079,715 $ 4,500,000 $ 7,757,974 -20.3% $ 10,069,883 $ 340,527 3.5% Health/Allied Health Optional: Cost of Operation Subsidy 1.0 Springfield Community College $21,070,398 $ 5,747,069 $ 6,874,664 $ 4,500,000 $ 17,121,733 -18.7% $ 21,807,862 $ 737,464 3.5% Business 2.7 1.5 $4,500,000 SYSTEM TOTAL $208,154,311 $ 80,327,156 $ 80,327,156 $ 67,500,000 $ 228,154,311 9.6% $ 228,154,311 $ 20,000,000 9.6% Services Designed by NCHEMS, 2013 1.0 Non-Credit Workforce Development The right side of the dashboard ( output side ) reflects the funding outcomes The left side of the dashboard ( input side ) can be changed, enabling a dynamic scenario-building assessment and development tool.
The Funding Formula Visualization Tool :The input side of the dashboard Stage One: Set Funding Allocations Allocate new money directly to Performance? No Total State and Local Appropriations $208,154,311 Base Funding Allocation 50% Amount Allocated: $70,327,156 Performance Funding Allocation 50% Amount Allocated: $70,327,156 Ancillary Budget Amount Amount Allocated: $20,000,000 Stage Two: Define Weight and Multiplier Values for Performance Allocations College Enrollment Variables College Completion Variables Certificate Completion Weight Associate Completion Weight Transfers Above 24 SCH Weight 30 Credits Hours Weight Completions: English Weight Completions: Math Weight Alignment Variables The Input side of the funding formula includes all of the component variables, weights, and multipliers Liberal Arts 1.0 10% Physical, Bio, Social Science Math and Computer Science Visual & Performing Arts At-Risk Multiplier: Pell Priority Certificate Multiplier Priority Associate Multiplier 1.5 15% 1.50 2.0 5% 1.30 1.5 5% 1.30 Pre-Education 1.5 7% Define Stop-Loss / Alt. Minimum Engineering / Architecture Developmental Education 2.0 8% 3.5% 1.5 Awards per 100 FTE 5% Define Stop-Gain / Alt. Maximum ATD Success Rate (3 Year Average) All weight percentages must equal 100% Optional: Cost of Operation Subsidy Trades 2.5 45% 100.0% Technologies 2.0 100% Health/Allied Health 2.0 Business 1.0 2.7 Services 1.5 $4,500,000 Designed by NCHEMS, 2013 Non-Credit Workforce Development 1.0
The Funding Formula Visualization Tool :The input side of the dashboard for funding amounts Stage One: Set Funding Allocations Allocate new money directly to Performance? Total State Appropriations for Community Colleges No FY14 total available to be allocated through the funding formula: $228,154,311* $208,154,311 Amount Allocated: Amount Allocated: Amount Allocated: 50% Base Funding Allocation $70,327,156 Performance Funding Allocation 50% $70,327,156 Ancillary Budget Amount $20,000,000 Cost of Operation Subsidy: $67,500,000 * In FY14 collective bargaining costs for all community college campuses were added to the campus base appropriations directly and were not subject to reallocation by the formula
Community College Funding Formula Basics of the Formula: Cost of Operation Subsidy The Task Force recommended that every institution receive a cost of operation subsidy reflective of the minimal requirement for operating a community college without regard to scale $4.5M was recommended as the per-institution subsidy, based an analyses conducted by NCHEMS The amount allocated to the Cost of Operation subsidy in FY14: $67.5M, or approximately 30% of the total available funding. This amount was deducted from the total available to be allocated through the Base and Performance funding metrics. Amount available to reallocate after cost of operation subsidy: $160.7M The Cost of Operation subsidy is recognized as one of the key areas of investigation for further refinement of the funding formula
Community College Funding Formula Components of the Formula: Base Funding Base and Performance Funding allocations are split 50/50 The amount allocated to base funding in FY14: $80,327,155 Base Funding is 35.4% of total amount allocated ($228M) Base Funding dollars are to be distributed based on student credit hours completed in the most recent academic year for which data are available (for the FY14 distribution, data from FY11 was used) By using Student Credit Hours the formula acknowledges institutional scale. The formula allocates the total base funding pool to the community colleges based on their percentage of total credit hours completed. The various credit hours are assigned individual weights based on the cost of instruction for the associated course or program. These weights reflect research and analyses conducted by NCHEMS
Community College Funding Formula Components of the Formula: Base Funding, Student Credit Hours Completed Student credit hours completed College Enrollment Variables Liberal Arts 1.0 Physical, Bio, Social Science 1.5 Math and Computer Science 2.0 Visual & Performing Arts 1.5 Pre-Education 1.5 Engineering / Architecture 2.0 Developmental Education 1.5 Trades 2.5 The added emphasis on non- credit workforce training was recommended by Labor and Workforce Development and Housing and Economic Development Technologies 2.0 Health/Allied Health 2.0 Business 1.0 Services 1.5 Non-Credit Workforce Development 1.0
Community College Funding Formula Components of the Formula: Base Funding, Application of Weights How are the assigned individual weights applied? The credits completed in the various discipline clusters are designated to have specific multipliers that range from 1.0 (no increased value) to 2.5 (two and a half times the raw value). The sum of the institutional credits (weighted by the discipline cluster multipliers) are divided by the sum of weighted credits for the entire segment to determine the share of base funds that will be allocated to each institution.
Community College Funding Formula Basics of the Formula: Performance Funding, College Completion College Completion Metrics include several measures of institutional effectiveness in encouraging students to achieve successful outcomes. College Completion Variables # of completed certificates Certificate Completion Weight 10% # of associates degrees Associate Completion Weight 15% # who transfer having completed 24 credits Transfers Above 24 SCH Weight 5% # complete 30 credits in any given year 30 Credits Hours Weight 5% # completing a credit-bearing course in English Completions: English Weight 7% # completing a credit-bearing course in Math Completions: Math Weight 8% Degrees and certificates per (FTE) students Awards per 100 FTE 5% Achieving The Dream Success Rate ATD Success Rate (3 Year Average) 45% All weight percentages must equal 100% 100%
Community College Funding Formula Basics of the Formula: Performance Funding, Alignment Weights The Alignment Metrics focus on areas of performance with specific relevance to The Vision Project the Board of Higher Education's strategic plan and the Governor s educational goals. The weights are only applied to completions The first metric addresses the goal of closing achievement gaps. [Weight applied to degree and certificates earned by students who were Pell Eligible] Alignment Variables At-Risk Multiplier: Pell 2.00 The last two metrics address the Governor s goals of adding credentials in fields of high employer demand. [Weights applied to certificates and associates in STEM fields, health care, life sciences, and IT] Priority Certificate Multiplier 1.30 Priority Associate Multiplier 1.30
Community College Funding Formula Basics of the Formula: Stop-Loss/Alternative Minimum Increase The Task Force determined that full implementation of the formula in year one would likely result in overly burdensome financial disruptions for many of the colleges. (For example, Springfield Tech would have experienced an 18.7% decrease in funds in year one) The Task Force initially agreed to include a 5% stop-loss provision that would prevent any one institution from losing more than 5% of their previous year s budget. It was ultimately decided that the formula would instead include a 3.5% alternative minimum provision, which ensures that each campus receives no less than a 3.5% increase. It was also decided that in subsequent years of funding there would be a transitional step taken annually with the goal of full implementation over 4 years (FY14 FY17). For FY15, the discussion has focused on reducing the alternative minimum increase.
The Funding Formula Visualization Tool :The output side of the dashboard New Funding Allocations FY14 New Funding Level - No Stop Loss New Funding Level - With Stop Loss Past Amounts Difference $ (+/-) between Stop Loss and FY13 GAA Massachusetts Public Community Colleges % Percentag Difference in Funding from FY13 Total Allocation After Stop Loss Adjustment Base Allocation ($) Performance Allocation ($) Cost of Operation Subsidy ($) FY13 Funding Amount Difference in Funding 2013 Total Allocation Berkshire Community College $7,988,207 $ 2,112,318 $ 3,330,594 $ 4,500,000 $ 9,942,912 24.5% $ 9,207,281 $ 1,219,074 15.3% Bristol Community College $13,885,391 $ 6,820,622 $ 7,076,763 $ 4,500,000 $ 18,397,385 32.5% $ 16,699,347 $ 2,813,956 20.3% Bunker Hill Community College $17,496,631 $ 8,912,763 $ 7,603,525 $ 4,500,000 $ 21,016,288 20.1% $ 19,691,704 $ 2,195,073 12.5% Cape Cod Community College $9,823,796 $ 3,224,452 $ 2,444,272 $ 4,500,000 $ 10,168,724 3.5% $ 10,167,629 $ 343,833 3.5% Greenfield Community College $7,805,889 $ 2,151,049 $ 3,146,823 $ 4,500,000 $ 9,797,872 25.5% $ 9,048,211 $ 1,242,322 15.9% Holyoke Community College $16,074,594 $ 5,969,313 $ 7,197,649 $ 4,500,000 $ 17,666,962 9.9% $ 17,067,692 $ 993,098 6.2% Massachusetts Bay Community $11,859,106 $ 4,470,668 $ 6,223,780 $ 4,500,000 $ 15,194,448 28.1% $ 13,939,229 $ 2,080,123 17.5% College Massasoit Community College $17,376,154 $ 6,702,109 $ 5,341,321 $ 4,500,000 $ 16,543,430 -4.8% $ 17,984,319 $ 608,165 3.5% Middlesex Community College $17,121,183 $ 8,213,614 $ 7,471,748 $ 4,500,000 $ 20,185,362 17.9% $ 19,032,193 $ 1,911,010 11.2% Mount Wachusett Community College $11,007,508 $ 4,743,484 $ 3,445,542 $ 4,500,000 $ 12,689,027 15.3% $ 12,056,206 $ 1,048,698 9.5% North Shore Community College $17,629,906 $ 6,369,881 $ 6,444,258 $ 4,500,000 $ 17,314,139 -1.8% $ 18,246,953 $ 617,047 3.5% Northern Essex Community College $16,305,635 $ 5,380,009 $ 6,239,967 $ 4,500,000 $ 16,119,976 -1.1% $ 16,876,332 $ 570,697 3.5% Quinsigamond Community College $12,980,557 $ 7,331,544 $ 6,406,535 $ 4,500,000 $ 18,238,079 40.5% $ 16,259,469 $ 3,278,912 25.3% Roxbury Community College $9,729,356 $ 2,178,260 $ 1,079,715 $ 4,500,000 $ 7,757,974 -20.3% $ 10,069,883 $ 340,527 3.5% Springfield Community College $21,070,398 $ 5,747,069 $ 6,874,664 $ 4,500,000 $ 17,121,733 -18.7% $ 21,807,862 $ 737,464 3.5% SYSTEM TOTAL $208,154,311 $ 80,327,156 $ 80,327,156 $ 67,500,000 $ 228,154,311 9.6% $ 228,154,311 $ 20,000,000 9.6% FY14 GAA allocated the additional $20M via earmarks in line-item 7100-4000
FY15 Budget Recommendation and Next Steps Roll $20M of FY14 earmarked funds into base appropriations of campus Recommend an additional $20M to be allocated using the same metrics in FY14 Hire a Data Auditor to test integrity and quality of data; ensuring uniform standards and definitions Discussion now underway to review minimum gain in FY15 with a goal of reaching a no fee consensus amongst all campuses Reconvene Formula Task Force to review and possibly refine elements of formula for FY16
Keys to Implementation in FY14 Strategic plan at the system level that outlined specific long-term measurable goals, including meeting projected workforce demand. Appealed to legislative interest in linking academic performance to funding. To that end, the Department of Higher Education was granted the statutory authority in FY12 to develop a funding formula for the community colleges which incorporates the allocation of appropriations based, in part, on performance. Established task force of community college presidents to determine overall approach and methodology. Critical to build consensus amongst campuses. Third-party formula development and validation. Clear communication of data standards, definitions, and measures. Incorporated a hold harmless feature that prevented any campus from receiving less than a 3.5% increase in year one. Pledge to not increase fees if funding formula is implemented with an additional $20M allocated over FY13. Commitment by Commissioner Freeland to both the Task Force and the Council of Presidents that the individual metrics, weights, multipliers, allocation balances, subsidy, etc were still open to review and enhancement in future funding cycles. A plan to establish an enhanced audit function to provide a greater assurance that formula is based on solid, reliable and appropriate representations of institutional accomplishments.
Additional Questions?
