Comparing 1750 to 1900: Population Growth in Britain
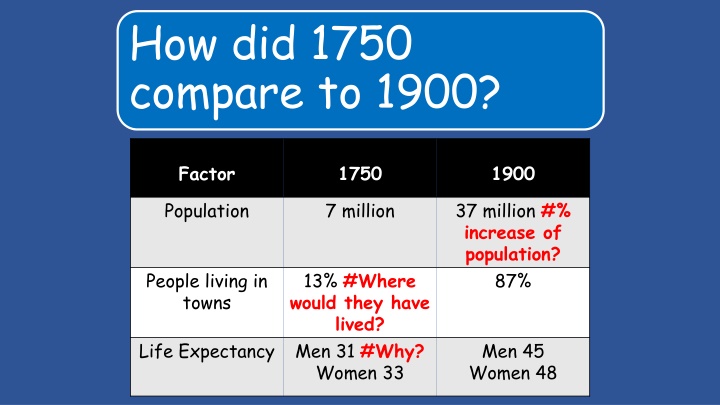
The population of Britain saw a significant increase between 1750 and 1900. In 1750, the population was 7 million, and by 1900, it had grown to 37 million. This represented an 87% increase. The number of people living in towns also rose from 13% to a higher percentage. Factors contributing to this growth included various socioeconomic changes. Men and women had different life expectancies, with men averaging 45 years and women 48 years. The population growth can be visually represented in a graph illustrating the population change over the years.
Download Presentation

Please find below an Image/Link to download the presentation.
The content on the website is provided AS IS for your information and personal use only. It may not be sold, licensed, or shared on other websites without obtaining consent from the author.If you encounter any issues during the download, it is possible that the publisher has removed the file from their server.
You are allowed to download the files provided on this website for personal or commercial use, subject to the condition that they are used lawfully. All files are the property of their respective owners.
The content on the website is provided AS IS for your information and personal use only. It may not be sold, licensed, or shared on other websites without obtaining consent from the author.
E N D
Presentation Transcript
How did 1750 compare to 1900? Factor 1750 1900 Population 7 million 37 million #% increase of population? 87% People living in towns 13% #Where would they have lived? Men 31 #Why? Women 33 Life Expectancy Men 45 Women 48
Why did the Population of Britain explode between 1750 and 1900? Learning Objective: To identify how Britain s population increased. To determine the main causes for this increase and begin to evaluate their impacts.
Between 1750 and 1900 the population in British towns went from 7 million to 37 million. What 3 factors lead to an increase in population? #Challenge: Which one of these has the biggest impact on Britain do you think?
Marvellous Maths Using the table below, create a graph that shows visually how the population of Britain changed between 1750 and 1900. 1750 1785 1800 1835 1850 1880 1900 7 million 9 million 11 million 18 million 21 million 28 37 million million
5 million = 2 lines 1750 1785 1800 1835 1850 1880 1900 7 million 9 million 11 18 21 28 37 16 lines in total million million million million million Every year measured = 2cm 14cm in total #Challenge: When did the biggest change in population occur? Using the data given where might you predict the population to be between 1900-1920? Why might this turn out to not be what you predicted? Can you work out the % increase between each time period indicated by the data?
1750 1785 1800 1835 1850 1880 1900 7 million 9 million 11 18 21 28 37 million million million million million #Challenge: When did the biggest change in population occur? Using the data given where might you predict the population to be between 1900-1920? Why might this turn out to not be what you predicted? Can you work out the % increase between each time period indicated by the data?
