Lithium Ion Conduction in Li2(OH)Cl Through DFT Simulations

DFT simulations of Li-ion conductor Li2(OH)Cl
Jason Howard, Natalie Holzwarth
Acknowledgements
Zach Hood
WFU Deac HPC Cluster
NSF grant DMR-1507942
Outline
•
Motivation
•
Background of material
•
Low temperature phase structure search
•
Molecular dynamics simulations of
high temperature phase
Motivation
Background of Li2OHCl
•
Two phases orthorhombic -> cubic(disordered) at 312K
•
Low temperature phase poor Li-ion conductor
•
Disordered cubic phase is a good Li-ion conductor
•
Has been cycled with a lithium anode with the apparent creation of stabilizing SEI layer
Hood, Zach et al. , Li2OHCl “
Crystalline Electrolyte for Stable
Metallic Lithium Anodes
”.
J. Am. Chem. Soc. 2016, 138,
1768−1771
•
312K
Methods
•
Quantum Espresso
QUANTUM ESPRESSO
.
(Giannozzi et al.
JPCM
21,
394402 (2009)
•
PAW formalism with LDA, data sets generated with
ATOMPAW
(Holzwarth et al.
CPC
135
, 329 (2001))
http://pwpaw.wfu.edu
Low Temperature structure
Cubic high temp phase
•
Orthorhombic, diffraction peaks available but no cif file as of yet
•
Rapid change in conductivity orthorhombic -> cubic indicates order-> disorder transition of
lithium sites
•
Schwering et. al. has experimentally predicted lattice parameters
Schwering, Georg CHEMPHYSCHEM 2003, 4, 343 - 348
•
My DFT studies predict a tetragonal ground state , a Orthorhombic structure slightly higher
in energy is also predicted
a
Li-vacancy
0.02 eV + Eo
Eo
Tetragonal
Orthorhombic
Yutao Li et al
International Edition: DOI:
10.1002/anie.201604554
Lattice parameters and XRD
•
Orthorhombic phase lattice parameters reported by Schwering et al. In angstrom
a – 3.82 b – 7.998 c – 7.74, ( b/2 = 3.999, c/2 = 3.87) Schwering, Georg CHEMPHYSCHEM 2003, 4, 343 - 348
•
Tetragonal lattice parameters (DFT) Orthorhombic lattice parameters (DFT)
a – 3.89 b – 3.89 c – 3.66 a – 3.83 b – 7.97 c – 3.6 (if scaled by 1.08 c = 3.81)
DFT tetragonal a, b, c scaled by 1.02
DFT orthorhombic a, b, c scaled 1.02
Hood, Zach et al. ,.
J. Am. Chem. Soc. 2016, 138, 1768−1771
Candidate DFT orthorhombic with a-axis and b-axis scaled by 1.02 and c-axis scaled by 1.08
DFT Orthorhombic a, b scaled 1.02, c scaled 1.08
Hood, Zach et al. ,.
J. Am. Chem.
Soc. 2016, 138, 1768−1771
Molecular Dynamics of disordered cubic phase
•
Started from randomly placing lithium on available sites
•
Used the micro-canonical ensemble , 1 shifted Kpoint, Ecut 45ryd, 1fm second t-step
“Scatter” plots of Lithium and hydrogen positions
Li vacancy
Goals of MD simulations
MSD(t)
MSD continued
0
25ps
Initial #1
Initial #2
(Initial #1)
Conclusions
•
T = 0K ground state predicated to be tetragonal
•
A candidate structure is found for the low temperature Orthorhombic structure
•
MD simulations show Lithium hopping that corresponds to the proposed model
for lithium jumps
•
Hydrogen positions qualitatively correlated with Li vacancies
•
Measurable diffusion occurring ~350K-650K but results are not converged enough to
produce accurate Arrhenius plots
Internal energy, kinetic energy, total energy and temperature
In Micro Canonical Ensemble
19ps
19ps
Order parameter analysis
DFT simulations were conducted on the lithium ion conductor Li2(OH)Cl to investigate its low and high-temperature phases. The motivation behind the study was to uncover the structural features impacting the phase transition and diffusion properties of the material. The background highlighted two phases of Li2(OH)Cl, with the disordered cubic phase exhibiting superior lithium ion conductivity. Quantum Espresso methods were employed for the simulations, revealing insights into the structure and transformation of the material. Experimental and theoretical data were integrated to predict the lattice parameters and ground state configurations, shedding light on the conductivity mechanisms in Li2(OH)Cl.

Download Presentation

Please find below an Image/Link to download the presentation.
The content on the website is provided AS IS for your information and personal use only. It may not be sold, licensed, or shared on other websites without obtaining consent from the author.If you encounter any issues during the download, it is possible that the publisher has removed the file from their server.
You are allowed to download the files provided on this website for personal or commercial use, subject to the condition that they are used lawfully. All files are the property of their respective owners.
The content on the website is provided AS IS for your information and personal use only. It may not be sold, licensed, or shared on other websites without obtaining consent from the author.
E N D
Presentation Transcript
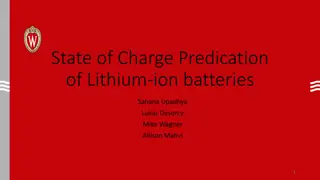
DFT simulations of Li-ion conductor Li2(OH)Cl Jason Howard, Natalie Holzwarth Acknowledgements Zach Hood WFU Deac HPC Cluster NSF grant DMR-1507942
Outline Motivation Background of material Low temperature phase structure search Molecular dynamics simulations of high temperature phase
Motivation Solid state , fast lithium ion conductor Finding structure for low temperature phase is stepping stone for understanding the phase transition. related materials ??2+???1 ??? , ??2(??)1 ?????, ??2?? ?? phase transitions or lack there of for the related materials Understanding the structure of the low temperature phase can help to understand the differences in the Understanding the properties of diffusion on a disordered lattice is of general interest In principle the combination of calculated tracer diffusion coefficients and experimentally measured conductivity can allow for a calculation of the Haven ratio.
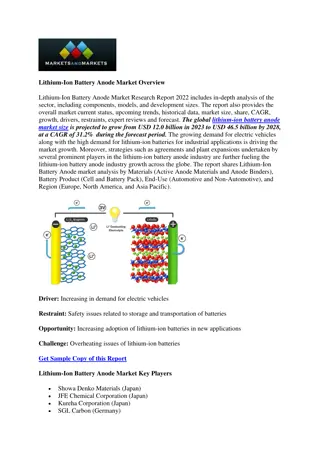
Background of Li2OHCl Two phases orthorhombic -> cubic(disordered) at 312K Low temperature phase poor Li-ion conductor Disordered cubic phase is a good Li-ion conductor Hood, Zach et al. , Li2OHCl Crystalline Electrolyte for Stable Metallic Lithium Anodes . J. Am. Chem. Soc. 2016, 138, 1768 1771 312K Has been cycled with a lithium anode with the apparent creation of stabilizing SEI layer
Methods Quantum Espresso QUANTUM ESPRESSO. (Giannozzi et al. JPCM 21, 394402 (2009) PAW formalism with LDA, data sets generated with ATOMPAW (Holzwarth et al. CPC 135, 329 (2001)) http://pwpaw.wfu.edu
Low Temperature structure Cubic high temp phase Orthorhombic, diffraction peaks available but no cif file as of yet Rapid change in conductivity orthorhombic -> cubic indicates order-> disorder transition of lithium sites Schwering et. al. has experimentally predicted lattice parameters Schwering, Georg CHEMPHYSCHEM 2003, 4, 343 - 348 Yutao Li et al International Edition: DOI: 10.1002/anie.201604554 My DFT studies predict a tetragonal ground state , a Orthorhombic structure slightly higher in energy is also predicted Eo Li 0.02 eV + Eo Orthorhombic Tetragonal O b Cl Li-vacancy c H a
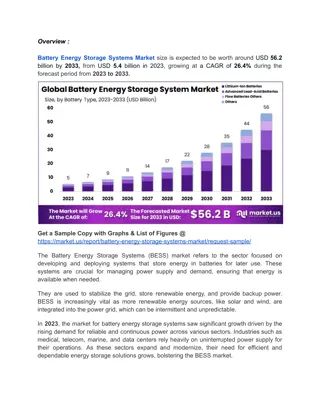
Lattice parameters and XRD Orthorhombic phase lattice parameters reported by Schwering et al. In angstrom a 3.82 b 7.998 c 7.74, ( b/2 = 3.999, c/2 = 3.87) Schwering, Georg CHEMPHYSCHEM 2003, 4, 343 - 348 Tetragonal lattice parameters (DFT) Orthorhombic lattice parameters (DFT) a 3.89 b 3.89 c 3.66 a 3.83 b 7.97 c 3.6 (if scaled by 1.08 c = 3.81) DFT orthorhombic a, b, c scaled 1.02 DFT tetragonal a, b, c scaled by 1.02 LiCl Hood, Zach et al. ,. J. Am. Chem. Soc. 2016, 138, 1768 1771
Candidate DFT orthorhombic with a-axis and b-axis scaled by 1.02 and c-axis scaled by 1.08 DFT Orthorhombic a, b scaled 1.02, c scaled 1.08 Hood, Zach et al. ,. J. Am. Chem. Soc. 2016, 138, 1768 1771 LiCl Azuma et al report and underestimation of up to 8% in the axis along the OH bond in ??(??)2 , ??(??)2, ????, ??? ???? Azuma et al , Computational and Theoretical Chemistry 963 (2011) 215 220
Molecular Dynamics of disordered cubic phase Started from randomly placing lithium on available sites Used the micro-canonical ensemble , 1 shifted Kpoint, Ecut 45ryd, 1fm second t-step Scatter plots of Lithium and hydrogen positions a c b b Li O Cl Li vacancy H
Goals of MD simulations Calculate tracer diffusion coefficients from slopes of mean square displacement vs time plots MSD(t) = 1 #?? (? ??? ?(??)??)2 MSD(t)?? vs t Avg Temp 630K 3.25?? 3.25?? MSD(t)?? MSD(t) 24ps 24ps Tracer diffusion coefficients are related to the ionic conductivity by the equation ? ? ??2 ???? ? ? = where ? ? - tracer diffusion coefficient G.E. Murch Solid State lonics 7 (1982) 177-198 ? - density of mobile ions per unit volume , ? - fundamental charge, ? Boltzmann constant ? temperature , ??- the Haven ratio
MSD continued (Initial #1) 340K 380K 430K 540K 580K 490K 635K 1.6?? 0 ? ? ??2 ???? 1 6MSD(t)??,??= ? (? ??) ? 25ps ? ? = 340K 380K 430K 490K 540K 580K 635K log(?*T) vs 1 1.6?? ? ? ?? ?) 2.5 log( Initial #2 Initial #1 ? ?? ?) 0.5 log( 0.004 ? 0.001 ? 0 25ps ? ?
Conclusions T = 0K ground state predicated to be tetragonal A candidate structure is found for the low temperature Orthorhombic structure MD simulations show Lithium hopping that corresponds to the proposed model for lithium jumps Hydrogen positions qualitatively correlated with Li vacancies Measurable diffusion occurring ~350K-650K but results are not converged enough to produce accurate Arrhenius plots
Internal energy, kinetic energy, total energy and temperature In Micro Canonical Ensemble 1 #?? (? ??? ?(??)??)2 Kinetic ( ) and internal ( ) MSD(t) = 1.2?? 0.75 0.65 0.55 19ps 19ps kinetic + internal Temperature 0.015 600K 0.01 500K 0.0 350K 19ps 19ps
time avg kinetic and internal time avg temperature 535K 0.68 520K 0.64 500K 0.61 19ps 19ps
Order parameter analysis Need a parameter that can gauge if the simulation is long enough Define ??? ?= ? 0 Because each site should be equally occupied and there are 3 sites for every 2 lithium's ??? ? ????? ?? where ???? = 1 if a lithium is occupying the site ? at time ? ???? = 0 if a lithium is not occupying the site ? at time ? 1 2 3 at long ? 2 3 ??? ? 0 for long ?. The index ? is for the possible Li sites in simulation cell For a supercell this leads to ? 2 3 ??? ? (?) 1 #?? (? ??? ?(??)??)2 MSD(t) = ? Avg Temp 630K 0.44 3.25?? 24ps 0.36 24ps
Effective temperature in the Micro canonical ensemble Tempurature flucates in MD simulation in small(not in Thermodynamic limit) supercell Calculated diffusion constants are an average over a range of temperatures ?? ????? ? ??? ?? ?????= ?(????) ?(?)?= ???? ???? = ??? Where ? ? probability of the Temperature T during the run. ???? is an effective temperature for the run
Cl")