Linear Regression and Bias in Statistical Analysis
Explore the concepts of linear regression, bias in statistics, and t-test reviews through practical examples and insightful explanations. Understand how to calculate error bounds, interpret t-test results, and analyze the relationship between variables using regression analysis. Dive into the assumptions underlying linear regression models for accurate data interpretation.

Download Presentation

Please find below an Image/Link to download the presentation.
The content on the website is provided AS IS for your information and personal use only. It may not be sold, licensed, or shared on other websites without obtaining consent from the author. If you encounter any issues during the download, it is possible that the publisher has removed the file from their server.
You are allowed to download the files provided on this website for personal or commercial use, subject to the condition that they are used lawfully. All files are the property of their respective owners.
The content on the website is provided AS IS for your information and personal use only. It may not be sold, licensed, or shared on other websites without obtaining consent from the author.
E N D
Presentation Transcript
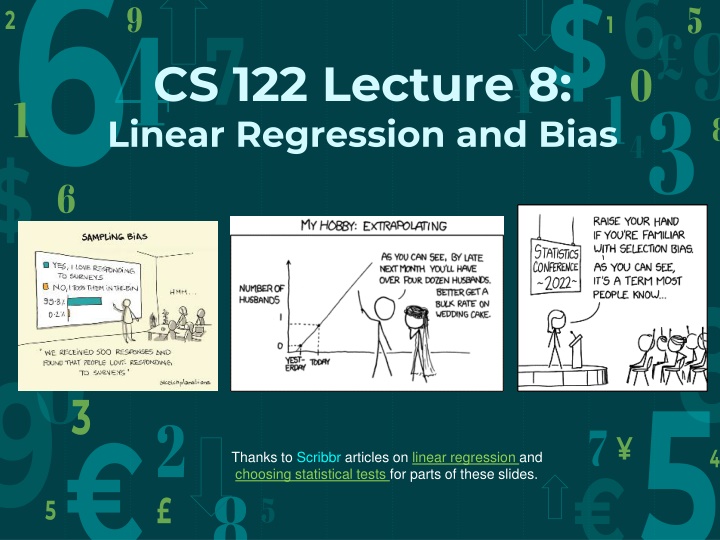
6 $ 9 5 2 1 9 4 7 CS 122 Lecture 8: Linear Regression and Bias 0 1 1 3 8 4 $ 6 8 0 2 9 3 5 2 7 Thanks to Scribbr articles on linear regression and choosing statistical tests for parts of these slides. 4 8 5 5
$ 6 1 5 9 0 Today's Agenda: 1 3 t-test Review 8 4 Linear Regression 2 5 Bias in statistics 7 4 8
$ 6 T-test Review 1 5 9 We need to know: sample average sample standard deviation sample size 0 1 ? ?? 1 ? 3 8 4 Use the formula above to calculate the distance from the mean of the error bound ?? ?: the t value for one less than the sample size (find this through a t-table or online calculator) ? : needed to look up our ?? ?. The area outside the desired confidence (if we want 99% calculate 1 - .99 = 0.01) ? : sample standard deviation n n : sample size 2 5 7 4 8 Add the result to the mean to get the upper bound. Subtract the result from the mean to get the lower bound.
$ 6 T-test Example 1 5 9 We have collected a sample of 31 energy bars from different stores to represent the population of energy bars available to the general public. The labels claim each bar contains 20 grams of protein. Is that within the 95% confidence interval? 0 1 3 8 4 We know: ?? 1 sample average sample standard deviation = 2.5418689 sample size alpha ? ? = 21.399562 2 = 31 = 0.05 5 ?31 1 2.54 7 31 4 2.0423 2.54 31= 0.93 look this up in a t-table or online calculator (choose 2 tails using alpha or 1 tail and alpha / 2) 8 Confidence interval = (21.3996 0.93, 21.3996 + 0.930) = (20.4696, 22.3296)
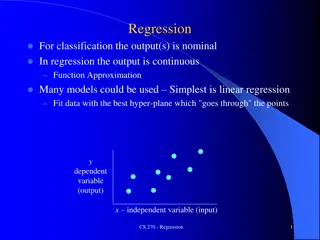
$ 6 Linear Regression 1 5 9 0 Used to estimate the relationship between two quantitative variables 1 3 Shows how strong the relationship is 8 4 The value of the dependent variable at a certain value of the independent variable 2 Regression models 5 Describe the relationship between variables by fitting a line to the observed data. 7 Linear use a straight line but there are many others as well 4 8
$ 6 Linear Regression Example 1 5 9 0 You are a social researcher interested in the relationship between income and happiness. 1 3 You survey 500 people whose incomes range from 15k to 75k and ask them to rank their happiness on a scale from 1 to 10. 8 4 2 Your independent variable (income) and dependent variable (happiness) are both quantitative, so you can do a regression analysis to see if there is a linear relationship between them. 5 7 4 8
$ 6 Linear Regression Assumptions 1 5 9 0 Homogeneity of variance (homoscedasticity): the size of the error in our prediction doesn t change significantly across the values of the independent variable. Independence of observations: the observations in the dataset were collected using statistically valid sampling methods, and there are no hidden relationships among observations. Normality: The data follows a normal distribution. Linear regression makes one additional assumption: 1 3 8 4 2 5 The relationship between the independent and dependent variable is linear: the line of best fit through the data points is a straight line (rather than a curve or some sort of grouping factor). 7 4 8
$ 6 Example 1 5 9 0 Can we use linear regression in the following situation? 1 3 8 Hypothesis: there is linear relationship between cured meat consumption and the incidence of colorectal cancer in the U.S. 4 2 Data: lots of data collected at high rates of meat consumption, much less at low rates of meat consumption. 5 Less data means less certainty We can be more certain of our result for high meat consumption than for low. 7 4 This doesn't meet the first assumption 8
$ 6 How to perform a linear regression 1 5 9 0 Goal: find best fit line through your data Accomplish this by searching for the regression coefficient (??) that minimizes the total error (?) of the model in the below equation. 1 3 8 4 ? = ?0+ ?1? + ? 2 ?: the predicted value of the dependent variable for any given value of the independent variable (?). ?0: the predicted value of ? when the ? is 0. ??: the regression coefficient how much we expect ? to change as ? increases. ?: the independent variable ( the variable we expect is influencing ?). ?: the error of the estimate, or how much variation there is in our estimate of the regression coefficient. 5 7 4 8
$ 6 1 How do we calculate this? 5 9 0 1 Assume our equation will be in the form: y = mx + b 3 8 4 1. Pick some values for m and b we think might work 2. Calculate the distance squared of each data point from the line this is our error 3. Repeat the last two steps 2 5 7 Choose the values for m and b that produced the smallest error 4 8
$ 6 1 How do we calculate this? 5 9 0 1 Conceptually: Assume our equation will be in the form: y = mx + b 3 8 4 1. Pick some values for m and b we think might work 2. Calculate the distance squared of each data point from the line this is our error 3. Repeat the last two steps 2 5 7 4 Choose the values for m and b that produced the smallest error 8
$ 6 1 The math 5 9 0 1 Using calculus, we can derive equations for m and b so we don't have to use a guess-and-check approach 3 8 4 ?? ? ?? ? 2 ? = 5 ? ???? ?? ?? ? ??2 ( ??)2 ? = 7 4 8 We could do this by hand but that would be tedious
$ 6 The math without math What we normally do in practice: Use a spreadsheet! 1 5 9 0 Excel: 1. 2. 3. 1 Select your data Click the Insert menu Click the down arrow next to the picture of a bunch of dots in the graphs section Click the first option for Scatter. You should now see a scatter plot on your sheet Click the graph and then click the green plus to its upper right Check the box next to Trendline and click the arrow to its right. Select More options Select the Linear radio button and, at the bottom, check the box next to Display Equation on chart 3 8 4 4. 2 5. 5 6. 7 7. 8. 4 8
$ 6 The math without math What we normally do in practice: Use a spreadsheet! 1 5 9 0 Google Sheets: 1. Select your data 2. Click the Insert menu and select Chart. You will see something like the screenshot to the right. 3. In the chart editor, change chart type to scatter 4. Open the series category in the chart editor. Scroll to the bottom of this section and check the box labeled Trendline. 5. Make sure Linear is selected as the type of trendline. 6. Click the Label dropdown menu and select Use Equation 1 3 8 4 2 5 7 4 8
$ 6 Calculating the error 1 5 We usually use R and ?2 R : The correlation between two variables sometimes called the Pearson correlation coefficient ?2: The percentage of the variation in the dependent variable that can be explained by the independent variable. Sometimes called the coefficient of determination 9 0 1 3 8 4 2 A larger value is better 5 7 4 8
$ 6 Which statistical test should we use? 1 5 9 0 1 3 8 4 We haven't covered all of these but, if you need the ones we didn't discuss, you now know enough to learn them on your own 2 (ex: Chi-square) 5 7 (Student's t) 4 8 This handy chart is from Scibbr
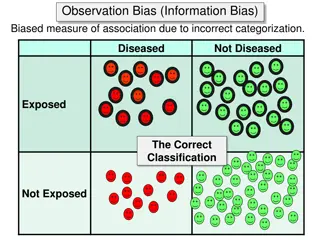
$ 6 Bias in statistics 1 5 Biases can cause terrible harm in the real world because we use algorithms based on statistics to make choices. 9 0 1 3 8 Examples: 4 Disease diagnosis where only symptoms of one demographic are included Recidivism likelihood calculation which includes salary, neighborhood, past interactions with law enforcement News echo chambers Choosing applicants to interview for a job Voice recognition not working for certain groups 2 5 7 4 8
$ 6 Common bias types 1 5 9 0 Sampling bias Time interval bias Susceptibility bias Confirmation bias Survivorship bias Omitted variable bias Recall bias Observer bias Funding bias 1 3 8 4 2 5 7 4 8
$ 6 Selection bias 1 5 Selecting a sample that isn't random Sampling bias: using a non- representative sample 9 0 1 3 8 Time interval bias: intentionally specifying a certain time to support a desired conclusion 4 2 Susceptibility bias: mixing up cause and effect and correlation 5 7 4 Confirmation bias: favoring information that confirms your beliefs 8
$ 6 Selection bias 1 5 Survivorship bias: only those who survived a long process are included 9 0 1 Omitted variable bias: absence of relevant variables in a model 3 8 4 Recall bias: participants do not remember past events, memories or details 2 Observer bias: observers are subjective in how they assess subjective criteria or record subjective information. Funding bias: tendency to skew a study or the results of a study to support a financial sponsor 5 7 4 8
$ 6 1 Data quality 5 9 0 1 Well known saying in machine learning: 3 8 Garbage in, garbage out 4 2 No matter how good our analysis is, we won't get accurate results if we start with inaccurate data 5 7 4 8
$ 6 1 5 9 0 Further reading 1 3 8 How to lie with statistics 4 Lessons on How to Lie with Statistics 2 Misleading statistics blog entry 5 Additional types of bias 7 4 8