League of Legends Analytics Project Overview
Dive into the world of League of Legends analytics with this project focused on setting up a game analytics pipeline and applying it to Riot Games' League of Legends. Explore parts like Damage versus Gold, Kills and Assists by Role, Champion Winrate, and more. Get hands-on with learning LoL, preparing and setting up data analysis, and analyzing player and champion data from the European Championship. Excel in this project to enhance your data analysis skills in the realm of online multiplayer battle arenas.
Download Presentation

Please find below an Image/Link to download the presentation.
The content on the website is provided AS IS for your information and personal use only. It may not be sold, licensed, or shared on other websites without obtaining consent from the author.If you encounter any issues during the download, it is possible that the publisher has removed the file from their server.
You are allowed to download the files provided on this website for personal or commercial use, subject to the condition that they are used lawfully. All files are the property of their respective owners.
The content on the website is provided AS IS for your information and personal use only. It may not be sold, licensed, or shared on other websites without obtaining consent from the author.
E N D
Presentation Transcript
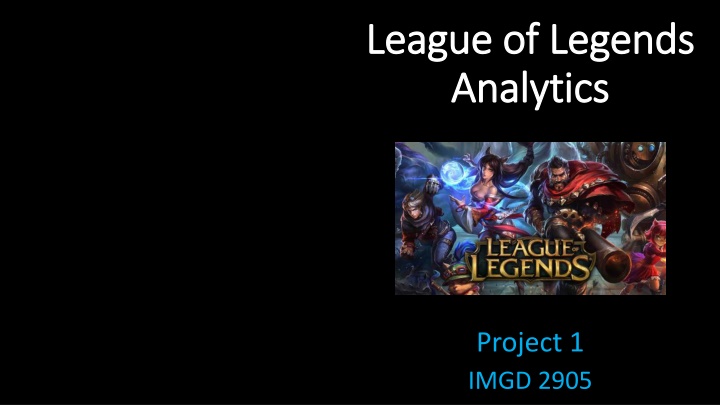
League of Legends League of Legends Analytics Analytics Project 1 IMGD 2905
Overview Overview Set up part of game analytics pipeline Apply to Riot Game s League of Legends Pipeline: Basic analysis this project, but repeat (reinforcement) + more later projects E.g., front end involves some scripting in Python Goal of this (and most) projects time with tools
Parts Parts Part 0 - Learn LoL, Prepare Setup Part 1 Damage versus Gold Part 2 Kills and Assists by Role Part 3 Champion Winrate Part 4 Your Choice Analysis Writeup (Submission and Grading)
Part 0 Part 0 Learn Learn LoL LoL, Prepare Setup , Prepare Setup Named part 0 since don t write up but foundational for rest of projects! 1. Learn LoL 2. Install Spreadsheet 3. Download dataset 4. Analyze
Part 0 Part 0 Learn League of Legends Learn League of Legends (1 of 2) (1 of 2) Multiplayer online battle arena PC game 5v5 match Each player controls 1 Champion (can pick from 148) Five roles: ADC, Jungle, Mid, Support, Top Champions upgraded with combat XP and gold New ability Augment existing ability Stats on kills, deaths, assists, damage
Part 0 Part 0 Learn League of Legends Learn League of Legends (2 of 2) (2 of 2) https://euw.leagueoflegends.com/en/ga me-info/get-started/new-player-guide/ Guide: 6
Parts Parts Part 0 - Learn LoL, Prepare Setup Part 1 Damage versus Gold Part 2 Kills and Assists by Role Part 3 Champion Winrate Part 4 Your Choice Analysis Writeup (Submission and Grading)
lec_playerdata.csv- Data on each individual player in the regular season games. lec_championdata.csv- Champion data on the in-game LoL Champions played with various performance stats. Part 0 Part 0 Prepare Analysis Setup Prepare Analysis Setup 1. Install spreadsheet 2. Download dataset 3. Try it out https://www.kaggle.com/stephenofarrell/league-of-legends-european-championship-2019 lec_matchdata.csv lec_playerdata.csv lec_championdata.csv Spreadsheet of data in columns
Part 1 Part 1 Damage versus Gold Damage versus Gold Gold used to buy items, make powerful Damage inflict on opponents Scatter plot Comma Separated Values (csv) DMG%, Gold%, 34.6, 29.6, 31.8, 28.1, 31.3, 30.2, Explore What are trends? Outliers? Writeup Chart Select columns Charts
Part 2 Part 2 Kills and Assists by Role Kills and Assists by Role But only 2 groups ADC Support Compute averages Position, Overall Chart and Table Sort by column Select some rows (e.g., ADC) Copy Summary stats Can make separate sheets Explore Differences? Explain? Writeup
Part 3 Part 3 Winrate Champion Champion Winrate Analyze winrates Histogram 10% bin size Chart - Drawing histogram - F1 help, too - How to make a histogram Explore Bin size difference? Ends? Writeup
Part 4 Part 4 Your Choice Your Choice Pick other data not yet analyzed Analyze Chart Table Summary stats E.g., other game stats (Deaths), roles (Jungle versus Mid), Champion selection rate, Game data (3rddata set)
Write Up Write Up (1 of 2) (1 of 2) Short report Content key, but structure and writing matter Consider: - Ease of extracting information - Organization - Concise and precise - Clarity - Grammar/English
Write Up Write Up (2 of 2) (2 of 2) Graphs/tables: Number and caption Referred to by number Labeled axes Explained trend lines Message Whatever document tool you want (e.g., Word, markdown) Generate PDF
Hints Hints Tips from previous years http://web.cs.wpi.edu/~imgd2905/d2 1/projects/proj1/#hints Use as checklist ! For most issues, will not be much penalty (yet) Learning analytics pipeline is iterative Will teach and reinforce But start instilling good habits! https://i0.wp.co m/www.johnha rdingestates.co. uk/wp- content/upload s/2018/02/John
Grading Grading 30% 30% 20% 10% Part 1 (D vs G) Part 2 (KA vs R) Part 3 (Wr HG) Part 4 (Choice) Misc All visible in report! 10%
Rubric Rubric 100-90. The submission clearly exceeds requirements. All parts of the project have been completed or nearly completed. The report is clearly organized and well-written, charts and tables are clearly labeled and described and messages provided about each part of the analysis. 89-80. The submission meets requirements. The first 2 parts of the project have been completed well, but not parts 3 or 4. The report is organized and well-written, charts and tables are labeled and described and messages provided about most of the analysis. 79-70. The submission barely meets requirements. The first 2 parts of the project have been completed or nearly completed, but not parts 3 or 4. The report is semi-organized and semi-well- written, charts and tables are somewhat labeled and described, but parts may be missing. Messages are not always clearly provided for the analysis. 69-60. The project fails to meet requirements in some places. The first part of the project has been completed or nearly completed, and maybe some of part 2, but not parts 3 or 4. The report is not well-organized nor well-written, charts and tables are not labeled or may be missing. Messages are not always provided for the analysis. 59-0. The project does not meet requirements. No part of the project has been completed. The report is not well-organized nor well-written, charts and tables are not labeled and/or are missing. Messages are not consistently provided for the analysis.
