KYTC Highway Information System (HIS) Overview
KYTC’s Highway Information System
(HIS)
Helping You Jump Start Your
Planning and Design
Data Gathering Efforts
Josh Wentz
KYTC Division of Planning
Data Management Branch Manager
Needs for Existing Data
Project Identification Form (PIF)
Needs for Existing Data
Purpose and Need Statement
Needs for Existing Data
Data Needs Analysis Study (DNA)
Needs for Existing Data
Planning Study
Needs for Existing Data
Project Approach
Needs for Existing Data
Design Executive Summary (DES)
Session Plan
•
HIS Overview – What’s in it?
•
Demo – HIVEi
•
Usage Limitations
•
Future Enhancements
HIS
HIS
Two Major Components
Road Centerlines
Road Centerlines
Tabular Road Data
Tabular Road Data
•
Spatial/GIS
representation of all public
road centerlines
•
KYTC, County, City, State Agencies, Federal
•
88,000 miles
•
Dual-carriageway
•
Linear Referencing System (LRS)
•
County, Route, & Milepoint locations
Road Centerlines
Road Centerlines
Road Centerlines
Tabular Road Data
•
48 data tables
•
440 attributes
•
8 data owners
•
14 data custodians
•
Varying extents, update cycles, and
levels of access
Tabular Road Data
- Highway Systems
Tabular Road Data - Roadway Information
Tabular Road Data - Roadway Features
Tabular Road Data - Other
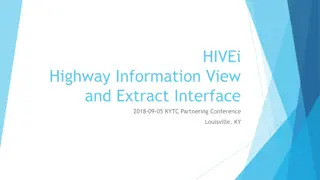
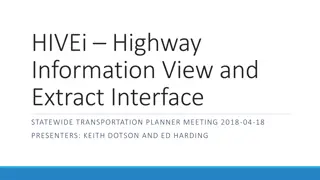
Highway Information View and Extract Interface
Highway Information View and Extract Interface
Highway Information View and Extract Interface
Highway Information View and Extract Interface
http://datamart.business.transportation.ky.gov/
EDSB_SOLUTIONS/hisextracts/
Usage Limitations
“Qualified
customers only. Available only at participating authorized dealers. Subject to credit approval.”
“Qualified
customers only. Available only at
participating authorized dealers. Subject to credit
approval.”
Usage Limitations
•
Planning-level data
•
Located by County, route, milepoint
•
Multiple uses
•
Original collection by 15 agencies
•
Predominant values
Usage Limitations
•
Horizontal Curve and Vertical Curve
•
Several different collection methods
•
Data affected by collector’s subjectivity
•
Best used for averaging over a section
•
Spot locations should be verified with other
methods
•
Speed Limit
•
Combination of Traffic Operations speed zone
Official Orders and field observations
•
Sign installations don’t always match location
specified in speed zone Official Order
Usage Limitations
•
Shoulders
•
Predominant values
•
Some inconsistencies with “combination” type
and lack of an attribute to hold paved width
Future Enhancements
•
More accessible, usable, and consistent
•
More data about the data (metadata)
•
Better integration with other KYTC
Bentley products
•
Paved width on “combination” shoulder
•
More intersection data
•
More bike/ped data
•
Speed data
Travel Time- Statewide Data
Travel Time- Statewide Data
2011 PM
Cardinal
Direction
2012 PM
Cardinal
Direction
Travel Time - Corridor Profiles
Travel Time - Corridor Profiles
Blue are
Minimum
Speeds
Red are
Maximum
Speeds
Arrow is the
direction of
travel at
Average
Speed
This is the End
Questions?
Comments?
Josh.Wentz@ky.gov
502-782-5090
Explore the Kentucky Transportation Cabinet's Highway Information System (HIS) designed to assist with planning and design data gathering efforts. Discover key components such as Existing Data Project Identification, Data Needs Analysis, and Road Centerlines information. Dive into the system's purpose, approach, design, and limitations, along with future enhancements and detailed data tables. Get insights into the spatial representation of road centerlines and the variety of data attributes available for analysis.

Download Presentation

Please find below an Image/Link to download the presentation.
The content on the website is provided AS IS for your information and personal use only. It may not be sold, licensed, or shared on other websites without obtaining consent from the author.If you encounter any issues during the download, it is possible that the publisher has removed the file from their server.
You are allowed to download the files provided on this website for personal or commercial use, subject to the condition that they are used lawfully. All files are the property of their respective owners.
The content on the website is provided AS IS for your information and personal use only. It may not be sold, licensed, or shared on other websites without obtaining consent from the author.
E N D
Presentation Transcript
KYTCs Highway Information System (HIS) Helping You Jump Start Your Planning and Design Data Gathering Efforts Josh Wentz KYTC Division of Planning Data Management Branch Manager
Needs for Existing Data Project Identification Form (PIF)
Needs for Existing Data Purpose and Need Statement
Needs for Existing Data Data Needs Analysis Study (DNA)
Needs for Existing Data Planning Study
Needs for Existing Data Project Approach
Needs for Existing Data Design Executive Summary (DES)
Session Plan HIS Overview What s in it? Demo HIVEi Usage Limitations Future Enhancements
Two Major Components HIS Tabular Road Data Road Centerlines
Road Centerlines Spatial/GIS representation of all public road centerlines KYTC, County, City, State Agencies, Federal 88,000 miles Dual-carriageway Linear Referencing System (LRS) County, Route, & Milepoint locations
Road Centerlines Attribute Comments Route Unique County #, Rt Prefix, Rt #, Rt Suffix, and Rt Section Begin Milepoint End Milepoint Road Name As provided by local agencies Surface Type DMI Length Government Level Road ownership indicator In miles, 3 decimal places Type of Operation 1-way, 2-way, Divided
Tabular Road Data 48 data tables 440 attributes 8 data owners 14 data custodians Varying extents, update cycles, and levels of access
Tabular Road Data- Highway Systems Table Data Owner Appalachian Development Highway System Planning Coal Haul Highway System Planning Drive Smart Corridors Highway Safety Extended Weight System Planning Forest Highway System Planning Federal Systems Planning (Functional Classification, NHS, Strahnet) Scenic Byway System Local Programs State Primary Road System Planning National Truck Network Planning
Tabular Road Data - Roadway Information Table Data Owner Access Control Planning Evaluation Sections (Homogenous Road Sections) Planning Type of Operation Planning Route Log Planning (Intersection Information) Speed Limit Traffic Operations Truck Weight Classification Maintenance
Tabular Road Data - Roadway Features Table Data Owner Auxiliary Lanes (Turn, TWLTL, Truck Climbing) Planning Bicycle and Pedestrian Facilities Planning Horizontal Curves Planning Vertical Curves / Grades Planning Through Lanes Planning Medians Planning Shoulders Planning
Tabular Road Data - Other Table Data Owner Traffic Planning (AADT, Truck Counts/%, Station Info) International Roughness Index (IRI) Maintenance Pavement Management (Year of Resurfacing, Thickness, Structural #) Maintenance
Highway Information View and Extract Interface http://datamart.business.transportation.ky.gov/ EDSB_SOLUTIONS/hisextracts/
Usage Limitations Qualifiedcustomers only. Available only at participating authorized dealers. Subject to credit approval. Qualified customers only. Available only at participating authorized dealers. Subject to credit approval.
Usage Limitations Planning-level data Located by County, route, milepoint Multiple uses Original collection by 15 agencies Predominant values
Usage Limitations Horizontal Curve and Vertical Curve Several different collection methods Data affected by collector s subjectivity Best used for averaging over a section Spot locations should be verified with other methods Speed Limit Combination of Traffic Operations speed zone Official Orders and field observations Sign installations don t always match location specified in speed zone Official Order
Usage Limitations Shoulders Predominant values Some inconsistencies with combination type and lack of an attribute to hold paved width
Future Enhancements More accessible, usable, and consistent More data about the data (metadata) Better integration with other KYTC Bentley products Paved width on combination shoulder More intersection data More bike/ped data Speed data
Travel Time- Statewide Data 2011 PM Cardinal Direction 2012 PM Cardinal Direction
Travel Time - Corridor Profiles Blue are Minimum Speeds Red are Maximum Speeds Arrow is the direction of travel at Average Speed
This is the End Questions? Comments? Josh.Wentz@ky.gov 502-782-5090