Key Concepts in Direct and Inverse Proportion on Graphs
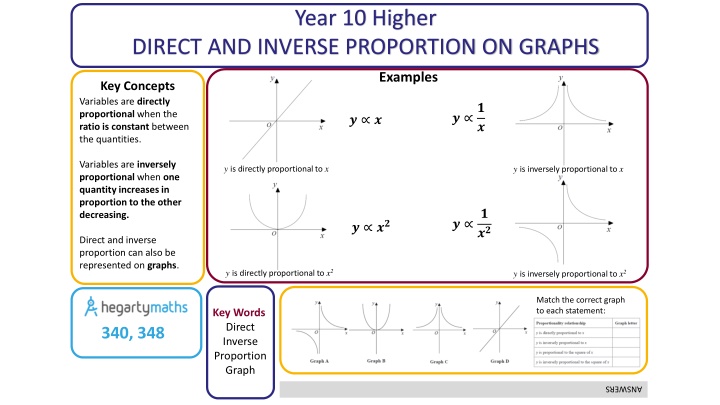
Variables exhibit direct proportion when a constant ratio exists between quantities, while inverse proportion occurs when one quantity increases as the other decreases. This concept is visually represented on graphs, where direct proportion follows y = kx and inverse proportion follows y = k/x.

Download Presentation

Please find below an Image/Link to download the presentation.
The content on the website is provided AS IS for your information and personal use only. It may not be sold, licensed, or shared on other websites without obtaining consent from the author.If you encounter any issues during the download, it is possible that the publisher has removed the file from their server.
You are allowed to download the files provided on this website for personal or commercial use, subject to the condition that they are used lawfully. All files are the property of their respective owners.
The content on the website is provided AS IS for your information and personal use only. It may not be sold, licensed, or shared on other websites without obtaining consent from the author.
E N D
Presentation Transcript
Year 10 Higher DIRECT AND INVERSE PROPORTION ON GRAPHS Examples Key Concepts Variables are directly proportional when the ratio is constant between the quantities. ? ? ? ? ? Variables are inversely proportional when one quantity increases in proportion to the other decreasing. y is directly proportional to x y is inversely proportional to x ? ?? ? ? ?? Direct and inverse proportion can also be represented on graphs. y is directly proportional to x2 y is inversely proportional to x2 Match the correct graph to each statement: Key Words Direct Inverse Proportion Graph 340, 348 ANSWERS
Year 10 Higher TYPES OF GRAPH Examples Reciprocal graphs ? =1 Circle graphs ?2+ ?2= 4 Quadratic graphs ? = ?2 Cubic graphs ? = ?3 ? ?2+ ?2= 6 ? = ? ? = ?3 2 ? = ?2+ 1 Match the graph with the correct equation: b) Key Words Quadratic Cubic Reciprocal Circle Graph 1) 2) 3) 4) 1 d) a) 257, 298-301, 314 c) ANSWERS: 1d 2b 3a 4c
Year 10 Higher QUADRATIC GRAPHS Line of symmetry ? = 1 Examples ? = ?2+ 2? 8 Key Concepts A quadratic graph will always be in the shape of a parabola. ? = ?2 A quadratic equation can be solved from its graph. The roots of the graph tell us the possible solutions for the equation. There can be 1 root, 2 roots or no roots for a quadratic equation. This is dependant on how many times the graph crosses the x axis. ? = ?2 The roots of a quadratic graph are where the graph crosses the x axis. The roots are the solutions to the equation. Roots ? = 4 ? = 2 y intercept = 8 Turning point ( 1, 9) Key Words Quadratic Roots Intercept Turning point Line of symmetry Identify from the graph of ? = ?2+ 4? + 3: 1) The line of symmetry 2) The turning point 3) The y intercept 4) The two roots of the equation 251-256 ANSWERS 1) ? = 2 2) ( 2, 1) 3) 3 4) ? = 1 ??? ? = 3
Year 10 Higher INEQUALITIES AND REGIONS ON GRAPHS Examples Key Concepts Highlight the region that represents the possible solutions to the following inequalities: ? 2 ? 2? ? + ? 3 Plot the points for each linear graph and draw the lines. Choose a coordinate whose values can be substituted in to each inequality. If the inequality is FALSE once values have been substituted in, then shade this area. You should be left with one area with no shading once you have repeated this for all inequalities. Each x is a possible set of integer values which are true for all three inequalities. Eg. (2,1), (2,2) (2,3) Inequalities can be represented on graphs. They highlight regions where all of the possible true values exist within its given constraints. Solid lines are used on the graph when are involved. Dashed lines are used on the graph when <> are involved. ? ? + 2 State the possible integer values that are true for the given inequalities. Key Words Region Inequality Solution 273-276 ? ? + 1 ? 1 ANSWER (1,0), (1,1), (1,2), (1,3), (0,1), (0,2)
Year 11 Higher (Unit 2) EXPONENTIAL GRAPHS Examples ? = 2? ? = 2 ? Key Concepts Find the value of ? when ? = 2 for both functions. Exponential graphs are those formed when there is a power of x e.g. When ? = 2 , ? = 1 When ? = 2 , ? = 1 ? = 2??? ? = 32? As the value of ? increases the ? value tends to infinity. As the value of ? decreases the ? value tends to 0 but never reaches it. As the value of ? decreases the ? value tends to infinity. As the value of ? increases the ? value tends to 0 but never reaches it. 1) Complete the values in the table for ? = ?? Key Words Exponential Infinity Function Power 2) Find the value of ? when ? = 0.8 x 0 1 2 3 302 y ANSWERS: 1a) 1, 3, 9, 27 2) ? = - 0.2


")
")