Isotopic Constraints on Methane Sources
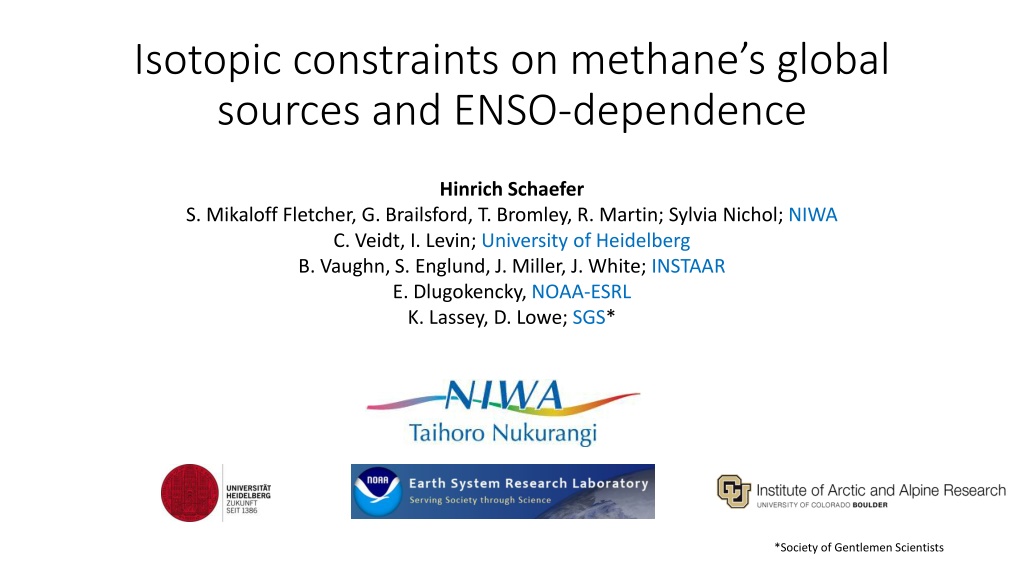

Isotopic constraints on methane’s global
sources and ENSO-dependence
Hinrich Schaefer
S. Mikaloff Fletcher, G. Brailsford, T. Bromley, R. Martin; Sylvia Nichol;
NIWA
C. Veidt, I. Levin;
University of Heidelberg
B. Vaughn, S. Englund, J. Miller, J. White;
INSTAAR
E. Dlugokencky,
NOAA-ESRL
K. Lassey, D. Lowe;
SGS
*
*Society of Gentlemen Scientists


Isotopic constraints on methane’s global
sources and ENSO-dependence
Schaefer et al., Science, 2016
Basic study design:
δ
13
CH
4
record
•
Create globally
averaged annual
δ
13
CH
4
from
records from
various
laboratories
Basic study design: box model
•
Small changes in
δ
13
CH
4
of global
source
•
Emissions decreased after 1993;
increased after 2006
•
Use 1-box model to identify
δ
13
CH
4
of “lost” emissions causing
plateau and of “new” emissions
for renewed rise
•
Identify isotopic leverage of
“changed” emissions (~ 20 Tg/a)
of total (~550 Tg/a) emissions
Basic study design: box model
Modelling approach:
•
For given sink, determine source history by inverse run
•
Pick onset of an event
•
In forward run, force continuation of previous trend (“base run”)
•
overlay source (or sink) “perturbation” to match atmospheric
history
Turn a faucet with set temperature on or off.
Calculates atmospheric
13
C from:
•
a global source and its
13
C/
12
C
•
Sinks and
13
C-fractionation
Atmosphere
Source
Sink
Emission rate
13
C
Removal rate
Fractionation
13
C
[CH
4
]
Findings I
Plateau caused by
“lost” emissions with
δ
13
CH
4
of ~ -40‰
►
Less fossil-fuel CH
4
(collapse of Soviet gas
production?)
Findings I
Plateau caused by
“lost” emissions with
δ
13
CH
4
of ~ -40‰
Alternatively,
OH-variability
(Montzka et al., 2011)
explains both
[CH
4
] and
δ
13
CH
4
Montzka et
al
., 2011
Findings II
•
“New” emissions
with
δ
13
CH
4
of
~ -60‰ cause
renewed rise
•
No (minor) fossil-
fuel CH
4
•
Biogenic source
•
Wetlands
•
Agriculture
Findings II
•
“New” emissions
with
δ
13
CH
4
of
~ -60‰ cause
renewed rise
•
Prescribed OH-
trend (-0.15%/yr)
matches [CH
4
],
but not
δ
13
CH
4
Advantages/limitations of study
•
No seasonal information (Martin Manning’s talk)
•
No geographic (latitudinal) information (inverse models)
But:
•
Sensitive to small changes in total source signature
•
Independent of prior estimates
•
Emission stacks (e.g.
Rice et al., 2016
)
•
Isotopic signature of sources (
Schwietzke et al., 2016
)
Finally:
•
Subject to same ambiguities from under-constrained system as other
studies
Points regarding newer findings
•
Role of OH-variability (sink)
•
Confirmed by
McNorton et al. (2016)
for plateau onset
•
Controversial for renewed rise (
Turner et al., 2017; Rigby et al., 2017
)
•
Role of fossil-fuel methane
•
Increase during plateau postulated by
Rice et al., 2016
•
Ethane trends: consistent with decrease during plateau (
Simpson et al., 2012
);
but increase since 2010 (
Helmig et al., 2016
; and other studies)
•
Nature of biogenic source
•
Agriculture
•
(Tropical) wetlands (
Nisbet et al., 2017
)
ENSO correlation with
δ
13
CH
4
El Nino Southern
Oscillation (ENSO):
•
Controls weather in
regions of tropical CH
4
production
•
Opposite influence on
wetlands and biomass
burning
•
Reinforcing influence
on
δ
13
CH
4
•
La Nina dominant
after 2007
El Nino
(cool, dry):
Biomass burning CH
4
(~-20‰)
Wetland CH
4
(~-58‰)
La Nina
(warm, wet):
Biomass burning CH
4
Wetland CH
4
ENSO correlation with
δ
13
CH
4
and HCN
•
HCN: biomass burning proxy
•
ENSO indices:
•
SOI: sea level pressure
•
ONI: sea surface temperature
•
MEI: multi-variate
Latitudes:
•
S. Tropics (Ascension Island, Samoa)
•
S. mid-latitudes (Baring Head, NZ)
•
Global
Allowing for different lag times
Rate of
δ
13
CH
4
variability explained by ENSO:
•
S. tropics: 0% - 32% (SOI)
•
S. mid-latitudes: 5% - 22% (SOI)
For HCN: up to 30% - 40% of
growth rate (MEI, ONI)
•
Global: 2% - 20% (SOI)
►
ENSO is minor driver of CH
4
cycle,
►
Stronger control on biomass
burning than wetlands
Parting thought
Emission rates (for stable OH):
•
Before 1992; after 2007:
•
low inter-annual variability (IAV).
•
Same trend?
•
1993 – 2006: high IAV; generally lower
With OH-variability (1994 – 2007;
Montzka et al., 2011
):
•
Some “improved” IAV during plateau
•
Some “worse” IAV afterwards
►
what causes the break in IAV pattern?
►
did it cause the plateau?
Study on global sources of methane and their dependence on ENSO, focusing on isotopic leverage of emissions changes over time. Findings include the impact of lost emissions causing a plateau in methane levels.

Download Presentation

Please find below an Image/Link to download the presentation.
The content on the website is provided AS IS for your information and personal use only. It may not be sold, licensed, or shared on other websites without obtaining consent from the author.If you encounter any issues during the download, it is possible that the publisher has removed the file from their server.
You are allowed to download the files provided on this website for personal or commercial use, subject to the condition that they are used lawfully. All files are the property of their respective owners.
The content on the website is provided AS IS for your information and personal use only. It may not be sold, licensed, or shared on other websites without obtaining consent from the author.
E N D
Presentation Transcript
Isotopic constraints on methanes global sources and ENSO-dependence Hinrich Schaefer S. Mikaloff Fletcher, G. Brailsford, T. Bromley, R. Martin; Sylvia Nichol; NIWA C. Veidt, I. Levin; University of Heidelberg B. Vaughn, S. Englund, J. Miller, J. White; INSTAAR E. Dlugokencky, NOAA-ESRL K. Lassey, D. Lowe; SGS* *Society of Gentlemen Scientists
Isotopic constraints on methanes global sources and ENSO-dependence Schaefer et al., Science, 2016
Basic study design: 13CH4 record Create globally averaged annual 13CH4 from records from various laboratories
Basic study design: box model Small changes in 13CH4 of global source Emissions decreased after 1993; increased after 2006 Use 1-box model to identify 13CH4of lost emissions causing plateau and of new emissions for renewed rise Identify isotopic leverage of changed emissions (~ 20 Tg/a) of total (~550 Tg/a) emissions
Basic study design: box model Small changes in 13CH4 of global source Emissions decreased after 1993; increased after 2006 Use 1-box model to identify 13CH4of lost emissions causing plateau and of new emissions for renewed rise Identify isotopic leverage of changed emissions (~ 20 Tg/a) of total (~550 Tg/a) emissions
Basic study design: box model Calculates atmospheric 13C from: a global source and its 13C/12C Sinks and 13C-fractionation Emission rate [CH4] Source 13C Atmosphere 13C Removal rate Sink Fractionation Modelling approach: For given sink, determine source history by inverse run Pick onset of an event In forward run, force continuation of previous trend ( base run ) overlay source (or sink) perturbation to match atmospheric history Turn a faucet with set temperature on or off.
Findings I Plateau caused by lost emissions with 13CH4 of ~ -40 Less fossil-fuel CH4 (collapse of Soviet gas production?)
Findings I Plateau caused by lost emissions with 13CH4 of ~ -40 Alternatively, OH-variability (Montzka et al., 2011) explains both [CH4] and 13CH4 Montzka et al., 2011
Findings II New emissions with 13CH4 of ~ -60 cause renewed rise No (minor) fossil- fuel CH4 Biogenic source Wetlands Agriculture
Findings II New emissions with 13CH4 of ~ -60 cause renewed rise Prescribed OH- trend (-0.15%/yr) matches [CH4], but not 13CH4
Advantages/limitations of study No seasonal information (Martin Manning s talk) No geographic (latitudinal) information (inverse models) But: Sensitive to small changes in total source signature Independent of prior estimates Emission stacks (e.g. Rice et al., 2016) Isotopic signature of sources (Schwietzke et al., 2016) Finally: Subject to same ambiguities from under-constrained system as other studies
Points regarding newer findings Role of OH-variability (sink) Confirmed by McNorton et al. (2016) for plateau onset Controversial for renewed rise (Turner et al., 2017; Rigby et al., 2017) Role of fossil-fuel methane Increase during plateau postulated by Rice et al., 2016 Ethane trends: consistent with decrease during plateau (Simpson et al., 2012); but increase since 2010 (Helmig et al., 2016; and other studies) Nature of biogenic source Agriculture (Tropical) wetlands (Nisbet et al., 2017)
ENSO correlation with 13CH4 El Nino Southern Oscillation (ENSO): Controls weather in regions of tropical CH4 production Opposite influence on wetlands and biomass burning Reinforcing influence on 13CH4 La Nina dominant after 2007 El Nino La Nina (cool, dry): Biomass burning CH4 (~-20 ) Wetland CH4 (~-58 ) (warm, wet): Biomass burning CH4 Wetland CH4
ENSO correlation with 13CH4 and HCN HCN: biomass burning proxy ENSO indices: SOI: sea level pressure ONI: sea surface temperature MEI: multi-variate Latitudes: S. Tropics (Ascension Island, Samoa) S. mid-latitudes (Baring Head, NZ) Global HCN12-24 gro vs ONI run 150.0 R = 0.398 100.0 50.0 0.0 -1.50 -1.00 -0.50 0.00 0.50 1.00 -50.0 -100.0 -150.0 SOI run vs BHD gro 0.150 R = 0.1625 0.100 0.050 Allowing for different lag times 0.000 -3.00 -2.00 -1.00 0.00 1.00 2.00 3.00 4.00 -0.050 -0.100
Rate of 13CH4 variability explained by ENSO: SOI (running mean) ONI (running mean) S. tropics: 0% - 32% (SOI) S. mid-latitudes: 5% - 22% (SOI) For HCN: up to 30% - 40% of growth rate (MEI, ONI) Global: 2% - 20% (SOI) ENSO is minor driver of CH4 cycle, Stronger control on biomass burning than wetlands Lag Lag r2 (months) r2 (months) HCN 0-100 km growth rate 0.24 2 0.32 2 12-24 km growth rate 0.26 1 0.40 1 d13CH4 global growth rate 0.11 2 0.07 10 BHD growth rate 0.16 0 0.05 0 ASC growth rate 0.23 0 0.08 1 ASC running mean 0.32 26 0.09 6 SMO running mean 0.22 20 0.08 17
Parting thought Emission rates (for stable OH): Before 1992; after 2007: low inter-annual variability (IAV). Same trend? 1993 2006: high IAV; generally lower With OH-variability (1994 2007; Montzka et al., 2011): Some improved IAV during plateau Some worse IAV afterwards what causes the break in IAV pattern? did it cause the plateau?