Integrating Renewable Energy Sources for Minnesota Power Utility: A 2025 Plan
"Students will design the integration of renewable or carbon-neutral energy sources into the electricity generation mix of Minnesota Power Utility to align with state and federal regulations. The plan involves transitioning from coal to hydro, wind, solar, natural gas, and purchased sources, with a focus on cost-effective solutions and reducing emissions. Key activities include designing the 2025 energy mix and estimating associated costs."
Download Presentation

Please find below an Image/Link to download the presentation.
The content on the website is provided AS IS for your information and personal use only. It may not be sold, licensed, or shared on other websites without obtaining consent from the author.If you encounter any issues during the download, it is possible that the publisher has removed the file from their server.
You are allowed to download the files provided on this website for personal or commercial use, subject to the condition that they are used lawfully. All files are the property of their respective owners.
The content on the website is provided AS IS for your information and personal use only. It may not be sold, licensed, or shared on other websites without obtaining consent from the author.
E N D
Presentation Transcript
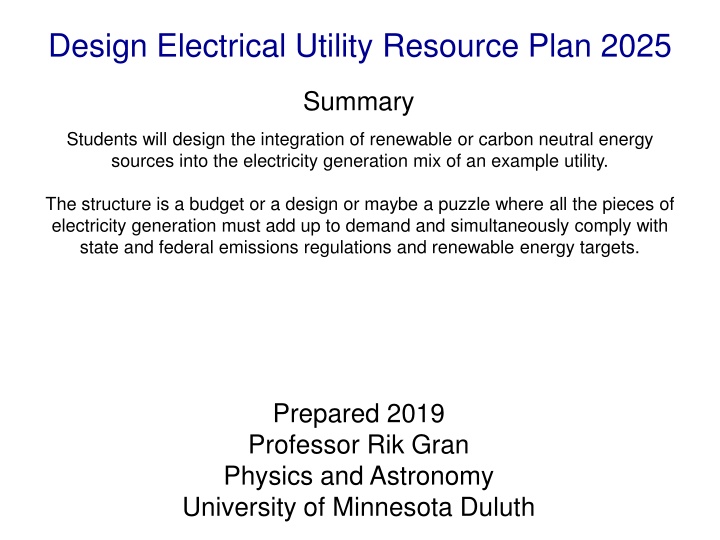
Design Electrical Utility Resource Plan 2025 Summary Students will design the integration of renewable or carbon neutral energy sources into the electricity generation mix of an example utility. The structure is a budget or a design or maybe a puzzle where all the pieces of electricity generation must add up to demand and simultaneously comply with state and federal emissions regulations and renewable energy targets. Prepared 2019 Professor Rik Gran Physics and Astronomy University of Minnesota Duluth
Minnesota Power in the year 2005 Small utility (but 2nd largest in MN) serves150,000 people Half (very high) of sales to mining, forestry, paper industries Peaks in winter heating season, more like Canada, not U.S. 1600 MW peak demand: 6% hydro and 94% coal Three coal facilities (10 generation units) with old emissions
Minnesota Power in the year 2010 Small utility (but 2nd largest in MN) serves150,000 people Half (very high) of sales to mining, forestry, paper industries Peaks in winter heating season, more like Canada, not U.S. 1600 MW peak demand: 6% hydro and 94% coal Three coal facilities (10 generation units) with old emissions Now 1900 MW peak demand, total delivered 13,500 GWh 5% hydro, 10% wind, 10% purchases , 75% coal Utility bought a transmission line, built wind in North Dakota Purchases used to manage growth without building facilities North Dakota is the Saudi Arabia of wind, subsidies available Transmission line was already built for an old coal plant.
Minnesota Power in the year 2015 to 2025 Year Peak MW 1500 Coal Hydro Wind Solar Natural Gas Purchases Peak reductions Transmission lines Storage for wind/solar Sum of costs (+10% profit) Renewable% 5% 15% 25% 2005 2010 1900 1500 100 200 2025 2010 Cost 1500 100 Activity for the week: Design the 2025 column And estimate its cost 200
Resource menu Description North Dakota Wind** *** Lake off-shore wind** Manitoba Hydro contract*** Utility scale solar farm** 20,000 homes solar roof Five = one nuclear reactor 200 M$ 100 $/MWh Continue coal (fuel+emissions) 150 M$ 40 $/MWh Natural Gas retrofit + fuel Biomass (paper waste) +coal Purchase high regional demand replace all old refrigerators 50 M$ 20 $/MWh replace all inefficient lighting 20 M$ 1 $/MWh $ incentive shift demand from peak 10 $/MWh *only one! **need load balancing ***need transmission line Resource 100 MW 100 MW 100 MW 100 MW 100 MW 100 MW 100 MW 100 MW 100 MW* 100 MW 5 MW* 20 MW* 75 MW* up-front costs levelized 200 M$ 50 $/MWh 500 M$ 150 $/MWh 300 M$ 100 $/MWh 500 M$ 150 $/MWh 40 $/MWh 100 M$ 50 $/MWh 50 $/MWh 100 $/MWh
Transmission and storage options Need to meet peak demand even at night or not so windy Extra transmission for 500 MW adds +5 $/MWh to costs You have 500 MW from North Dakota, already paid for. For every 200 MW of Wind or 100 MW of solar (Its always somewhat windy, but never sunny at night) Grid connected battery, adds 20 $/MWh to the cost OR grid connected pumped hydro, adds 10 $/MWh OR use 50 MW of existing or new hydro behind dam OR use 50 MW of natural gas The latter two can not be double counted toward peak So to use the existing 100 MW of hydro to support wind you need to raise your target demand from 2100 to 2200.
Example of adding storage or transmission 400 Wind so use Thompson Dam + One Unit of Battery Storage Year Peak MW 1500 Coal Hydro Wind Solar Natural Gas Purchases Peak reductions Transmission lines none! under 500 MW from No. Dak. Storage for wind/solar 1 battery Sum of costs + 10% profit Renewable% 5% 15% 23% = 500/2150 (need more) 2005 2010 1900 1500 100 200 200 2025 2150 (= 2100 + 50) 100 $ 0 400 $160 =4x40 Cost 1500 100 Thompson dam is paid for! All wind is newish paying off loans $ 20 $180 + 18 = $198
Resource menu after technology improvements Resource Description 100 MW North Dakota Wind** *** 100 MW Lake off-shore wind** 100 MW Manitoba Hydro contract*** 100 MW Utility scale solar farm** 100 MW 20,000 homes solar roof 100 MW Five = one nuclear reactor 200 M$ 100 $/MWh 100 MW Continue coal (fuel+emissions) 150 M$ 40 $/MWh 100 MW Natural Gas retrofit + fuel 100 MW* Biomass (paper waste) + coal mix 100 MW Purchase high regional demand 5 MW* replace all old refrigerators 50 M$ 10 $/MWh 20 MW* replace all inefficient lighting 20 M$ 10 $/MWh 75 MW* $ incentive shift demand from peak 10 $/MWh *only one! **need load balancing ***need transmission line up-front costs levelized 150 M$ 40 $/MWh 300 M$ 100 $/MWh 150 M$ 50 $/MWh 300 M$ 100 $/MWh 40 $/MWh 100 M$ 50 $/MWh 50 $/MWh 100 $/MWh
Minnesota Power from their 2015 plan Year Peak MW 1500 Coal Hydro Wind Solar Natural Gas Purchases Peak reductions Transmission = one from Manitoba Storage for wind/solar none needed Sum of costs + 10% profit Renewable% 5% 15% 40% (More than needed!) 2005 2010 1900 1500 100 200 200 2025 2300 900 400 500 100 300 (small) 100 Cost 1500 100 $360 =9x40$/MWh $120 =3x40 $200 =5x40 $ 50 =1x50 $150 =3x50 $ 10 =yes do all $ 5 $895 + $90 = $985
