Insights on Mississippi Economy and Employment Trends
The data showcases a nuanced analysis of the Mississippi economy, highlighting growth in private services and the recovery progress of employment post-economic downturns. While private sectors show improvement, challenges like high unemployment and weak housing persist, with long-term economic challenges still looming. The visual representations depict a gradual recovery trend in employment levels, paralleling the national index, with Madison's payroll employment outpacing state averages.

Download Presentation

Please find below an Image/Link to download the presentation.
The content on the website is provided AS IS for your information and personal use only. It may not be sold, licensed, or shared on other websites without obtaining consent from the author.If you encounter any issues during the download, it is possible that the publisher has removed the file from their server.
You are allowed to download the files provided on this website for personal or commercial use, subject to the condition that they are used lawfully. All files are the property of their respective owners.
The content on the website is provided AS IS for your information and personal use only. It may not be sold, licensed, or shared on other websites without obtaining consent from the author.
E N D
Presentation Transcript
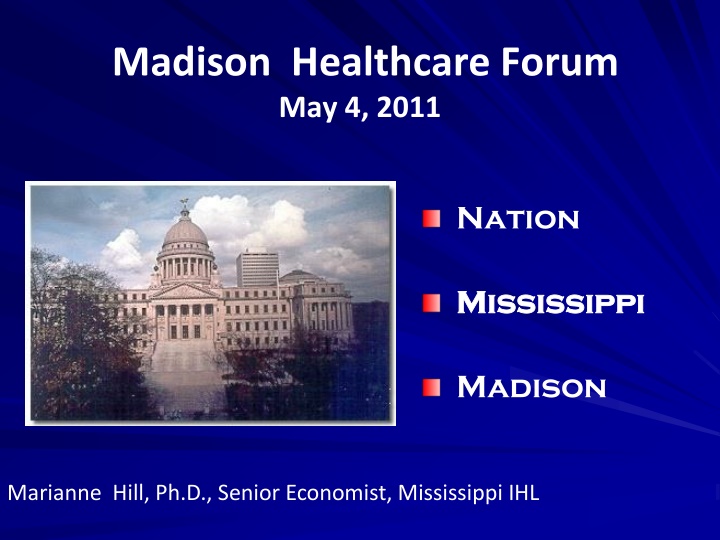
Madison Healthcare Forum May 4, 2011 Nation Mississippi Mississippi Madison Marianne Hill, Ph.D., Senior Economist, Mississippi IHL
National Economy: Out of the Woods? Almost. Private sector jobs up Consumer spending stronger Exports, equipment sales up Government spending falling Oil prices high Unemployment high, housing weak Toxic financial assets still on books
Mississippi Economy: Private Services Leading the Way Jobs, sales, taxes improving Major projects on-line Private service jobs strong Consumers uncertain Manufacturing lagging nation Stimulus funds gone Long-term challenges on hold
MS Employment: Recovery Has Far to Go 102 100 98 96 94 92 90 88 -6 0 Feb 08 - Present Jun 80 - Sep 1986 6 12 18 24 30 May 2000 - Dec 2007 Jun 80 - Sep 1987 36 42 48 54 60 Jun 80 - Sep 1985 66 72 78 84 90 Employment is indexed to month of peak employment level 4
Mississippi Parallels US Employment Index 2007 - 2012 Employment as % of 2007:Q1 Employment Level 102 MS US 100 98 96 Percent 94 92 07Q1 08Q1 09Q1 10Q1 11Q1 M 12Q1 Year Source: MS Center for Policy Research & Planning, I.H.S. Global Insight.
MS Regains 2000 Employment In 2015 EMPLOYMENT AS A PERCENTAGE OF 2000 EMPLOYMENT LEVELS, U.S. & MISSISSIPPI MS US 108 106 104 102 100 98 96 94 92 199619982000 2002 2004 2006 2008 MS 2010 2012 2014 Year Source: MS Center for Policy Research & Planning, I.H.S. Global Insight.
Madison Payroll Employment Outpaces State PAYROLL EMPLOYMENT IN MADISON AND REST OF STATE 2001 = 100 Total State Madison 150 130 110 90 M T Source: MS Dept. of Employment Security
p 7% Alcorn 50% De Soto 9% Benton 7% Tippah 6% 2% 14% Tate 17% Tunica Marshall Tishomingo Prentiss 7% Union 1% Panola 22% Lafayette -19% Quitman 9% Lee 3% -15% Coahoma 12% Pontotoc Itawamba Mississippi Population Change 2000 to 2010 -3% 3% -1% Calhoun Yalobusha -11% Chickasaw -3% Monroe Tallahatchie -16% Bolivar -6% Grenada -6% Clay -14% Sunflower 0% -15% Leflore -3% Webster -10% Montgomery -2% Carroll 11% Oktibbeha Lowndes -12% Choctaw -19% Washington -16% Humphreys -11% Holmes -5% Winston -8% 0% Attala Noxubee -25% Sharkey 0% Yazoo 14% Leake 3% 0% -38% Issaquena Neshoba Kemper 27% Madison -1% Scott -1% Newton 3% -2% Warren 23% Rankin -2% Hinds Lauderdale -7% Clarke -6% Jasper -19% Claiborne 2% Smith 0% 2% Copiah Simpson -21% Jefferson -2% Wayne 4% Jones 1% -11% -2% 5% Lincoln Covington Jefferson Davis Lawrence -6% Adams -4% Franklin 6% Marion 42% Lamar 8% -4% -3% Amite 4% Pike 2% 3% Forrest 1% Perry Greene Wilkinson Walthall 18% George -100% to -1% 0% to 6% 7% to 51% 31% Stone 15% Pearl River 6% -1% Harrison Jackson 2% Hancock
Major New & On-Going Projects Toyota Auto Plant $1.3 billion LNG Project $1.1 billion Port at Gulfport $570 million Stion $500 million Severstal Expansion $500 million KiOR $500 million Schulz Extruded Products $300 million Twin Creeks Technologies $175 million Source: Mississippi Authority Development
Growth in State General Fund Transfers ( FY2010 vs. FY2011, Through April) Sales Tax 1 Indiv Income Tax 4.4 Corpor Income Tax 7.5 Use Tax -3.7 Gaming Fees&Taxes -1.2 Insur Premium Tax 12.9 2.9 TOTAL G.F. Revenue -6 -4 -2 0 2 4 6 8 10 12 14 Percentage Change SOURCE: MS Dept of Revenue.
Health Leads State Employment Growth 2009 to 2010 PERCENTAGE CHANGE IN EMPLOYMENT Constr Manuf Finance -8.4 -3.4 -2 Leisure,Hosp -1.3 Trade -0.1 Business,Prof 0.2 0.4 Govt Transport,Util Health,Social 1.3 2.7 Mining TOTAL 3.6 -1.3 -10 -8 -6 -4 -2 0 2 4 Percentage Change Source: Data from MS Dept of Employment Security.
Health Long-Term Leader Employment Growth: 2000 2010 Health,Social Asst 2.9 Govt 0.6 Business,Prof Transport,Util Finance Leisure,Hosp 0.5 0.4 -0.2 -0.4 -0.8 Mining Trade Constr Manuf TOTAL -0.9 -1 -3.9 -0.6 -5 -3 -1 1 3 Percentage Change Source: Data from MS Dept of Employment Security.
Mississippi Employment Growth March 2010 to March 2011 CHANGE IN EMPLOYMENT Business,Prof 10.9 Mining Constr 3.6 3.6 Health,Social Transport,Util 2.8 1.5 Trade 1 0.3 Leisure,Hosp Finance -1.6 -1.7 Manuf Govt TOTAL -2.3 0.8 -10 -8 -6 -4 -2 0 2 4 6 8 10 12 14 Percentage Change Source: Data from MS Dept of Employment Security.
MS Health and Other Sectors vs. US (Percent) 23% MS US 20% 17% 16% 13% 13% 13% 11% 11% 9% 10% 8% 4% 4% 4% 0% Source: US Bureau of Labor Statistics.
Forecast Growth Rate of Employment 2011 2016 Average Annual Rate Business,Other Serv Health & Social Asst Construction Transport & Utilities Manufacturing 2.6 2.4 2.4 2.2 1.8 Trade 1.3 0.9 Leisure,Hospitality Agric, Forest,Fish Government Finance, Real Est 1.2 0.6 0.5 Mining TOTAL -1.2 1.5 -2.5 -1.5 -0.5 0.5 1.5 2.5 3.5 Source: MS Center for Policy Research and Planning.
Health Care & Economy Employment, payrolls, tax revenues Multiplier impact Out-of-state sales In-state purchases Federal matching funds Higher worker productivity Research creating spin-offs Rate of increase in cost problematic
Countries with Highest Per Capita Health Expenditures 2008 OECD Countries with Highest Per Capita Health Care Expenditures 2008 (Plus France, Germany & Sweden) $8,500 $7,538 $7,500 $6,500 $5,500 $5,003 $4,927 $4,237 $4,079 $4,063 $4,500 $3,737 $3,470 $3,500 $3,008 $2,500 Source: OECD.
Madison County Employment By Sector 2010 Other 20% Trade 21% Prof & Business Serv 12% Government 11% Leisure & Hosp 12% Health & Ed 10% Manuf 14% Source: MS Dept of Employment Security.
Average Annual Growth of Employment In Health & Educ. Services 2001 to 2010 9.7% 5.9% 4.1% 2.8% 2.7% 2.3% U.S. MS. Madison Rankin Hinds DeSoto
Physicians Per 1,000 Persons & County Health Outcomes Physicians per 1,000 Outcome Rank Hinds 6.6 39 Rankin 1.8 3 Madison 1.5 7 DeSoto 1.1 1 Mississippi 1.9 (State health outcomes rank 50th among states.) Source: CountyHealthRankings.org
IN SUMMARY Mississippi economic outlook slow but positive growth Employment back to 2000 level by 2015 Health care leader in employment growth Madison health care sector: broad impact Multipliers AND higher worker productivity Health costs & competitiveness Key sector for state and Madison
MISSISSIPPI ECONOMIC REVIEW & OUTLOOK and MISSISSIPPI S BUSINESS at www.mississippi.edu/URC Join MS Economy Listserve: contact mhill@mississippi.edu