Economic and Demographic Trends in Federated States of Micronesia (1945-2004)
Population growth, employment trends, educational attainment, fishing enterprise profits, tourism statistics, subsistence economy share, and agricultural exports in Federated States of Micronesia between 1945 to 2004. The data covers resident and non-resident populations, employment in FSM and abroad, educational levels, fishing enterprise profits, visitors to FSM, subsistence economy share, and agricultural exports including marine products.
Download Presentation

Please find below an Image/Link to download the presentation.
The content on the website is provided AS IS for your information and personal use only. It may not be sold, licensed, or shared on other websites without obtaining consent from the author.If you encounter any issues during the download, it is possible that the publisher has removed the file from their server.
You are allowed to download the files provided on this website for personal or commercial use, subject to the condition that they are used lawfully. All files are the property of their respective owners.
The content on the website is provided AS IS for your information and personal use only. It may not be sold, licensed, or shared on other websites without obtaining consent from the author.
E N D
Presentation Transcript
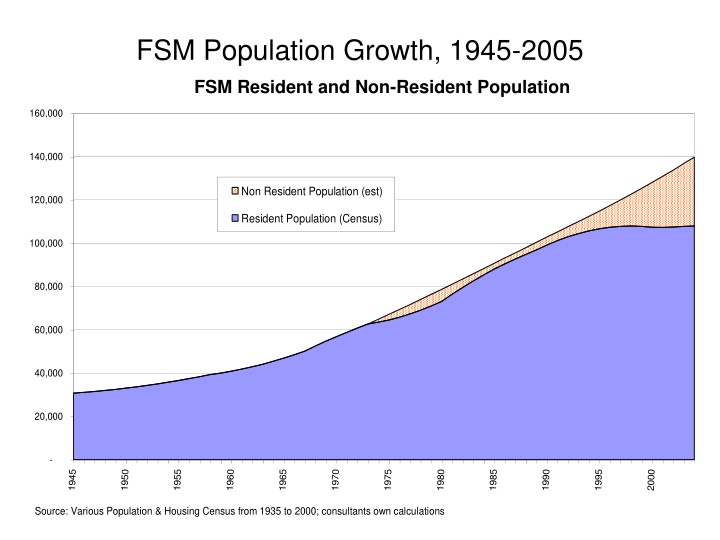
FSM Population Growth, 1945-2005 FSM Resident and Non Resident Population FSM Resident and Non-Resident Population 160,000 140,000 Non Resident Population (est) 120,000 Resident Population (Census) 100,000 80,000 60,000 40,000 20,000 - 1945 1950 1955 1960 1965 1970 1975 1980 1985 1990 1995 2000 Source: Various Population & Housing Census from 1935 to 2000; consultants own calculations
Employmentin FSM and Abroad, 1987-2004 (Number of Jobs) 1987 1995 2004 In FSM 12,209 16,003 15,156 Overseas (est) 729 2,063 7,947
Educational Level of FSM Residents and Emigrants (Hawaii survey 1998 and FSM Census 2000) Percent with High School Diploma Percent with College Degree 6.0% 60.0% 53.0% 5.0% 5.0% 50.0% 36.0% Proportion of Population Proportion of Population 4.0% 40.0% 30.0% 3.0% 2.0% 20.0% 2.0% 10.0% 1.0% 0.0% 0.0% In FSM Overseas In FSM Overseas
Profit & Loss in FSM Public Owned Fishing Enterprises $0.0m -$0.02m -$1.0m 1993 1994 1995 1996 1997 1998 1999 -$2.0m -$2.1m -$2.2m -$2.7m -$3.0m -$4.0m -$5.0m -$5.4m -$6.0m -$6.1m -$7.0m -$8.0m -$8.6m -$9.0m -$10.0m Source: Matthew Jacobs, (2002) Micronesian Counsellor, Issue 40.
Visitors to FSM, 1996-2004 Tourism International Arrivals 25,000 20,038 20,000 18,700 18,496 18,159 18,004 17,083 15,512 15,494 14,275 15,000 10,000 5,000 0 1996 1997 1998 1999 2000 2001 2002 2003 2004 Source: FSM Department of Economic Affairs
Subsistence Share of Total FSM Economy 1987-2004 30.0% 25.0% 20.0% 15.0% 10.0% 5.0% 0.0% FY87 FY88 FY89 FY90 FY91 FY92 FY93 FY94 FY95 FY96 FY97 FY98 FY99 FY00 FY01 FY02 FY03 FY04e Source: FSM Department of Economic Affairs
Agricultural Exports from FSM Exports ($,000s) Commodity 1992 1993 1994 2000 2001 2002 Copra Banana Citrus Kava Betel Nuts Black Pepper Root Crops Other Fam Commodities Total Agriculture Exports 222 278 15 0 390 456 186 72 44 152 625 201 33 23 160 908 211 26 28 241 888 754 8 -- 9 -- -- 94 32 11 267 36 85 530 252 95 91 327 -- -- -- 4 30 30 17 25 306 958 30 1,680 1,620 1,139 1,367 1,428 Marine Products Offshore Fish Reef Fish Crab/Lobsters Trochus Shells/Meat Other Marine Products Total Marine Exports 19,485 25,217 73,573 12,143 12,100 101 178 8,796 110 206 -- -- -- 75 65 75 97 172 524 39 3 430 13 -- -- 3 -- 30 42 26 20,113 25,325 74,113 12,432 12,382 9,138 Other Products Garments Handicrafts & Souvenirs Cooked Food Other Products N.E.C. Total Other Exports 2,045 2,055 2,161 240 3,010 4,391 3,591 35 -- 85 -- 24 9 11 11 -- 191 232 17 251 22 168 39 6 2,248 2,164 2,440 3,216 4,651 3,875 23,319 29,169 78,173 16,787 18,400 14,441 TOTAL EXPORTS _____________________ Source:FSM Trade Bulletin No.9, Department of Economic Affairs, Statistics Unit, November 1998.
FSM Imports and Exports, 1994-2004 $40.0m Exports $20.0m $0.0m -$20.0m -$40.0m -$60.0m -$80.0m -$100.0m Imports -$120.0m -$140.0m -$160.0m 1994 1995 1996 1997 1998 1999 2000 2001 2002 2003 2004
FSM Balance Sheet 1994-2004 Current Account Balance $40.0 $35.4 $30.0 $18.9 $20.0 $16.2 $10.0 $6.5 US$m $4.7 $3.9 $0.7 $0.0 FY94 FY95 FY96 FY97 FY98 FY99 FY00 FY01 FY02 FY03 FY04 -$5.1 -$5.7 -$10.0 -$11.9 -$20.0 -$23.9 -$30.0
