Insights on Biogeochemical Processes and Metal Interactions in Marine Environments
Delve into the intricate relationships between metals, stoichiometry, and biological quotas in marine ecosystems. Explore the impact of metal interactions on biogeochemical provinces, resource supply stoichiometry, and the constraints they impose on marine biota. Uncover how deep chlorophyll maxima, iron limitation, and particulate metals shape phytoplankton functional groups and influence metal quotas. Dive into the significance of metal-metal interactions, the estimation of metal quotas from pigment abundance, and the potential of metalloproteomics in shaping future research directions.
Download Presentation

Please find below an Image/Link to download the presentation.
The content on the website is provided AS IS for your information and personal use only. It may not be sold, licensed, or shared on other websites without obtaining consent from the author.If you encounter any issues during the download, it is possible that the publisher has removed the file from their server.
You are allowed to download the files provided on this website for personal or commercial use, subject to the condition that they are used lawfully. All files are the property of their respective owners.
The content on the website is provided AS IS for your information and personal use only. It may not be sold, licensed, or shared on other websites without obtaining consent from the author.
E N D
Presentation Transcript
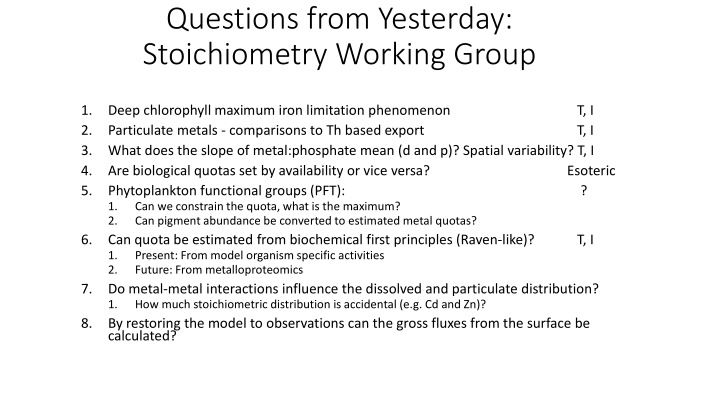
Questions from Yesterday: Stoichiometry Working Group 1. 2. 3. 4. 5. Deep chlorophyll maximum iron limitation phenomenon Particulate metals - comparisons to Th based export What does the slope of metal:phosphate mean (d and p)? Spatial variability? T, I Are biological quotas set by availability or vice versa? Phytoplankton functional groups (PFT): 1. Can we constrain the quota, what is the maximum? 2. Can pigment abundance be converted to estimated metal quotas? Can quota be estimated from biochemical first principles (Raven-like)? 1. Present: From model organism specific activities 2. Future: From metalloproteomics Do metal-metal interactions influence the dissolved and particulate distribution? 1. How much stoichiometric distribution is accidental (e.g. Cd and Zn)? By restoring the model to observations can the gross fluxes from the surface be calculated? T, I T, I Esoteric ? 6. T, I 7. 8.
Potential Micronutrient Data Products How do metals and metal interactions shape biogeochemical provinces? Resource supply stoichiometry -> map of geographic regimes Compare to demand, identify biogeochemical provinces Link to particles and export, compare supply and loss Estimated demand by quotas and published growth rates Redfieldian analysis of dissolved and particulates metals, use/regeneration Mining of available omics data Deep chlorophyll maximum natural laboratory iron-light co- limitation analysis of dFe/N comparisons, relevant omics information Bioavailability, metal quotas and uptake rates in the oceans. Acquisition of iron case study using resource supply stoichiometry. Overview paper with highlights what has GEOTRACES taught us? What could be done in the future to extend our knowledge?
How does the Resource Supply Stoichiometry set constraints on the biota? Fe:PO4 (mmol mol-1) Ratio of the physical supply of Fe and PO4 calculated from GEOTRACES data and hydrography/Argo Work by Shaun Rigby (Univ Liverpool)
1nM diss Fe Diatom North Atlantic 17N, 18W HOT synechococcus HOT prochlorococcus
