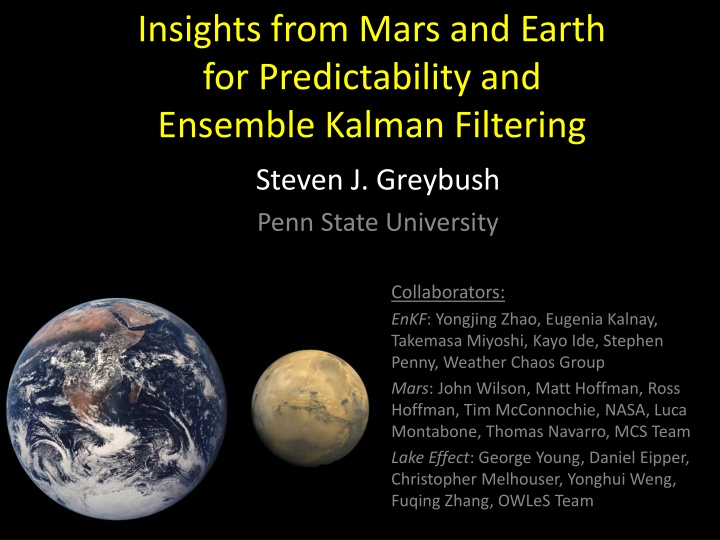
Insights from Mars and Earth for Predictability with Ensemble Kalman Filtering
A collaborative effort between Penn State University and various teams explores the predictability of Martian and Earth weather phenomena using ensemble Kalman filtering. A comparison of key characteristics between Earth and Mars is provided, shedding light on their variable atmospheres and climates. The features of Martian weather are detailed, including diurnal cycles, polar ice caps, and seasonal variations. The spacecraft exploration of Mars, from the Mariner program to the Mars Science Laboratory, showcases our ongoing efforts to understand the Red Planet's atmospheric dynamics. The EMARS system utilizes spacecraft observations for reanalysis, enhancing our grasp of Martian atmospheric processes.

Download Presentation

Please find below an Image/Link to download the presentation.
The content on the website is provided AS IS for your information and personal use only. It may not be sold, licensed, or shared on other websites without obtaining consent from the author.If you encounter any issues during the download, it is possible that the publisher has removed the file from their server.
You are allowed to download the files provided on this website for personal or commercial use, subject to the condition that they are used lawfully. All files are the property of their respective owners.
The content on the website is provided AS IS for your information and personal use only. It may not be sold, licensed, or shared on other websites without obtaining consent from the author.
E N D
Presentation Transcript
Insights from Mars and Earth for Predictability and Ensemble Kalman Filtering Steven J. Greybush Penn State University Collaborators: EnKF: Yongjing Zhao, Eugenia Kalnay, Takemasa Miyoshi, Kayo Ide, Stephen Penny, Weather Chaos Group Mars: John Wilson, Matt Hoffman, Ross Hoffman, Tim McConnochie, NASA, Luca Montabone, Thomas Navarro, MCS Team Lake Effect: George Young, Daniel Eipper, Christopher Melhouser, Yonghui Weng, Fuqing Zhang, OWLeS Team
Comparing the Earth and Mars Variable Radius Earth 6378 km Mars 3396 km Gravity 9.81m s-2 3.72m s-2 Solar Day 24 hours 24 hours 39 minutes Year 365.24 earth days 686.98 earth days Obliquity (Axial Tilt) 23.5 deg 25 deg Primary Atmospheric Constituent Surface Pressure Nitrogen and Oxygen Carbon Dioxide 101,300 Pa 600 Pa Deformation Radius 1100 km 920 km Surface Temperature 230-315 K 140-300 K Table Courtesy of Matthew Hoffman and John Wilson
Features of Martian Weather Figure Courtesy of NASA/JPL and Malin Space Science Traveling Weather Systems Diurnal Cycle, Thermal Tides, Topography Seasonal CO2 Polar Ice Caps Water Ice Clouds Dust Devils, Regional and Global Storms Olympus Mons Water Ice Clouds Hellas Basin Seasonal CO2 Polar Ice Cap MGS Mars Orbital Camera (MOC) Visible Image
Spacecraft Exploration of Mars Mariner 67.gif Mars Mars Global Surveyor: TES, MOC, MOLA Reconnaissance Orbiter: MCS, MARCI File:Mars global surveyor.jpg Mars Odyssey: Imaging and Spectrometry Mars Reconnaissance Orbiter.jpg Mariner Program: Observed Dust Storms Mars Science Laboratory (MSL) Curiosity rover Launched Nov. 2011, Arrived on Mars Aug. 2012 Rover Environmental Monitoring Station (REMS) Air and Ground Temperature, Winds, Surface Pressure, Relative Humidity, UV Radiation 2015 1970 1980 1990 2000 2010 1960 Images Courtesy of Wikipedia Viking Lander: Surface Pressure Time Series Mars Exploration Rovers: Dust Devils Viking lander model.jpg Mars Pathfinder: Surface Weather Mars Phoenix Lander: Precipitation, Water Ice
EMARS: Ensemble Mars Atmosphere Reanalysis System Spacecraft Observations: TES (Thermal Emission Spectrometer) and MCS (Mars Climate Sounder) temperature and aerosol retrievals. For assimilation, create superobservations. See poster for improved retrieval assimilation strategy that removes influence of prior and error correlations. File:Mars global surveyor.jpg Mars Reconnaissance Orbiter.jpg Spacecraft Horizontal Coverage in 6hrs Spacecraft and Model Vertical Coverage
EMARS: Ensemble Mars Atmosphere Reanalysis System Spacecraft Observations: TES (Thermal Emission Spectrometer) and MCS (Mars Climate Sounder) temperature and aerosol retrievals. Model: GFDL Mars Global Climate Model (MGCM). ~300 km horizontal resolution Assimilation System: 4d-LETKF Reanalysis Product Contains: 3 Years of TES, 1+ Years of MCS analyses. Hourly fields of temperature, winds, surface pressure, aerosol. Atmospheric state and its uncertainty (ensemble means and spread). Spacecraft and Model Vertical Coverage
Validation Strategy Comparisons with freely running forecasts. RMSE and bias of short term forecasts initiated from ensemble analyses. Comparisons to independent radio science profiles and rover data. Feature-based evaluation: traveling waves, tides, aerosols.
Improving LETKF Performance Freely Running Model Initial Assimilation Adaptive Inflation (Miyoshi 2011) Varying Dust Distribution Empirical Bias Correction (Danforth et al., 2007) Evaluated by comparing 0.25 sol forecasts with observations.
NH Autumn Ls 185-203 MCS TES Bias MCS TES Random Error
Mars Synoptic Weather Maps: Can we converge upon a synoptic state? Shading: Temperature Anomalies (2 K intervals); Contours: Surface Pressure Anomalies; Vectors: Wind Anomalies
NH Traveling Wave Comparison *Preliminary* Limited Duration Comparison MY 24 Ls 206-224 0.25 sol granularity MACDA Reanalysis (Plotted SJG) At 60 S, MGCM Level 20, MCD Dust TES FFSM (Plotted RJW) Courtesy of Jeff Barnes EMARS Reanalysis (Plotted SJG) At 60 S, MGCM Level 20, TES Dust, BC
Courtesy of Grad Student Yongjing Zhao Resonance induced to Semi-Diurnal Tide by 6-hr Data Assimilation Windows
Equatorial daily ave analysis increment, with RAC 6hr, localization radius=600 (original) 6hr, DA at hr03,09,15,21 Localization radius = 600 6hr, localization radius=1200 Courtesy of Grad Student Yongjing Zhao 2hr, localization radius=600 1hr, localization radius=600 12hr, localization radius=600
Courtesy of Grad Student Yongjing Zhao Resonance induced to Semi-Diurnal Tide by 6-hr Data Assimilation Windows Wave 4 spatial pattern of observation increments modulates semi-diurnal tidal modes through constructive interference. (On Mars, topography also modulates the tides.) Solution: Use shorter assimilation window (1 or 2 hours)
Regions of Chaotic and Stable Dynamical Error Growth: Implications for Ensemble Spread, Inflation Fixed Dust, Fixed Inflation Fixed Dust, Adaptive Inflation Temperature Bred Vector (Fixed Dust) 4 K Pseudo-Pressure (hPa) No Observations, No Inflation 2 K 0 K Varying Dust, Fixed Inflation Varying Dust, Adaptive Inflation Estimated Inflation (Varying Dust) 50 % No Observations, No Inflation Pseudo-Pressure (hPa) 10 % 0 % Latitude Latitude Latitude Contours: Temperature Ensemble Mean; Shaded: Temperature Ensemble Spread, Bred Vector, or Inflation
Ensemble Spread Evolution At a given model grid point and time t we can write: Analysis Step: a(t) = b(t) i(t-1) r(t) Forecast Step: b(t+1) = a (t) gm(t) r(t) : the reduction in spread due to observations increasing our knowledge of the state r = (1 K H)0.5 i(t): the (post-)inflation at time step t gm(t) : the change in ensemble spread due to the growth, decay, or advection of dynamical instabilities in the model from time t to time t+1
Sources of Forecasting Error Dynamical Instabilities / Chaos Small differences in initial conditions between two similar states grow until the error saturates and they are no different than two random states from climatology. Model Error / Forcing Model errors have both random and systematic components. In a forced system, spread decreases over time as states are forced to converge. If the model attractor differs from the real attractor, error will instead grow until it saturates at the difference in forcing.
Courtesy of Grad Student Yongjing Zhao Forecast Skill on Mars NH Summer NH Autumn
Improving Aerosol Representation MCS Free Runs: Observation minus Model Bias Seasonal Dust, No Ice Cloud Seasonal Dust + Ice Cloud 3 Tracers + Ice Cloud MCS Assimilation: Observation minus Model Bias Seasonal Dust, No Ice Cloud Seasonal Dust + Ice Cloud 3 Tracers + Ice Cloud
MGCM vs. MCS Aerosol Opacities Normalized to 610 Pa MCS Retrieved Aerosol MGCM Forecast Aerosol Challenges for GCMS: Mars GCMS do not yet handle detached dust layer very well. Dust lifting is also difficult to determine due to observation limitations and finite surface dust reservoirs.
TES Begins MY 24 MCS Begins 2001 Global Dust Storm MY 28 MY 25 MY 26 MY 29 TES Ends MY 30 MY 27 Mars Climate Database 5 Dust Visible ColumnOpacity Courtesy of Luca Montabone
Greybush et al. Oxford Mars Workshop Strategies for Analyzing Aerosol Constrain vertical distribution: From aerosol vertical profiles. From temperature fields. Constrain column opacity: From brightness temperature fields. From column opacity products. Estimate model / assimilation parameters: Distribution of increment among tracer sizes. Ice cloud radiative scaling factor.
Features of Martian Weather Inform Assimilation System Design Figure Courtesy of NASA/JPL and Malin Space Science Diurnal Cycle, Thermal Tides, Topography Traveling Weather Systems Water Ice Clouds Seasonal CO2 Polar Ice Caps Dust Devils, Regional and Global Storms Optimal Window Length and Inflation Localization Scales, Verification Metrics Tuning Model Physics, Model Error Enforcing CO2 Conservation Representing Aerosols in Ensemble MGS Mars Orbital Camera (MOC) Visible Image
Features of Martian Weather Inform Assimilation System Design And Motivate Science Questions Figure Courtesy of NASA/JPL and Malin Space Science Diurnal Cycle, Thermal Tides, Topography Traveling Weather Systems Water Ice Clouds Seasonal CO2 Polar Ice Caps Dust Devils, Regional and Global Storms Optimal Window Length and Inflation Localization Scales, Verification Metrics Tuning Model Physics Enforcing CO2 Conservation Representing Aerosols in Ensemble What is the predictability horizon for Mars weather forecasting? What instabilities give rise to forecast errors and changes in wave regimes? How well are tides and traveling weather systems depicted in reanalyses, and can they be linked to dust lifting? What is the spatial distribution and time evolution of ice and dust aerosol? What mechanisms are responsible for global dust storm formation?
Lessons Learned on Mars We have successfully created a multiannual reanalysis for Mars. Need to validate system using several metrics designed to evaluate each aspect of Mars weather. Observation increments must respect physical balances of the dynamical system: be careful of resonant tidal modes. Address model bias: empirical bias correction, or by improving aerosol. Address model error / spread: adaptive inflation, variability in aerosol and physics. Next steps: atmosphere and aerosol analysis.
Lake Effect Snow: Assimilation and Prediction with WRF-EnKF OWLeS: Ontario Winter Lake-effect Systems (LeS) December 2013-January 2014 Mission Statement from http://www.owles.org/: The OWLeS project examines the formation mechanisms, cloud microphysics, boundary layer processes and dynamics of lake-effect systems (LeS) at unprecedented detail using X- band and S-band dual-polarization (dual-pol) radars, an aircraft instrumented with particle probes and profiling cloud radar and lidar, a mobile integrated sounding system, a network of radiosondes, and a surface network of snow characterization instruments. Lake-effect systems form through surface-air interactions as a cold air mass is advected over relatively warm (at least partially) ice-free mesoscale bodies of water. The OWLeS project focuses on Lake Ontario because of its size and orientation, the frequency of LeS events (especially intense single bands), its nearby moderate orography, the impact of Lake Ontario LeS hazards in particular on public safety and commerce, and the proximity of several universities with large atmospheric science programs.
Lake Effect Snow: Formation Factors Instability driven by difference in temperature from lake surface to atmosphere during strong cold air advection. Heat and moisture fluxes from lake depend on ice cover. Wind direction and shear, as well as lake orientation / fetch determine type of convection. Topography enhances snowfall. Multiscale problem: synoptic setup, mesoscale details.
Lake Effect Experiment Design Current Planned 27 / 9 / 3 km domain 9 / 3 / 1 km domain Assimilate conventional, mesonet observations Also assimilate radar, field campaign observations. Near real time forecast Ensemble Reanalysis and Forecasts IC/BC from GFS IC/BC from GEFS Case Studies Dec 2013 Jan 2014
Preliminary Results: Dec 11 2013 Lake Effect Event Comparisons are also underway with independent field campaign observations, including sondes and aircraft in situ data.
Scale Window Length Predictability Oceans Hours to Days months Synoptic Scale 6-12 hours 2 weeks Mars 1, 6 hours Days Mesoscale ~ 1 Hour Hours to days Lake Effect 1 hour Hours to days Storm Scale Minutes Minutes to hours