Insight into Legislative Processes

 undefined
C
r
e
a
t
i
n
g
a
n
d
U
n
d
e
r
s
t
a
n
d
i
n
g
P
i
e
C
h
a
r
t
s


W
h
a
t
i
s
a
P
i
e
C
h
a
r
t
?
A
p
i
e
c
h
a
r
t
i
s
a
c
i
r
c
u
l
a
r
c
h
a
r
t
(
p
i
e
-
s
h
a
p
e
d
)
;
i
t
i
s
s
p
l
i
t
i
n
t
o
s
e
g
m
e
n
t
s
t
o
s
h
o
w
p
e
r
c
e
n
t
a
g
e
s
o
r
t
h
e
r
e
l
a
t
i
v
e
c
o
n
t
r
i
b
u
t
i
o
n
s
o
f
c
a
t
e
g
o
r
i
e
s
o
f
d
a
t
a
.
How do I draw a pie chart?
Step 1
1.
Decide on the total number of categories. In other words, identify the
categories that you will use.
2.
Collect the data so the number per category can be counted
(Frequency Table)
How do I draw a pie chart?
Step 2
To calculate
degree share, you
need to divide the
share that the
category has by
the total units and
then multiply by
360 (there are
360 degrees (°) in
a circle).
How do I draw a pie chart?
Step 3 – Drawing the chart
1
st
Draw a Circle
With a protractor measure
72
o
Mark this angle and
draw a line from the
centre to the mark
Turn the protractor
so that the zero is
now on this line
Now measure 108
o
Now measure 90
o
And finally 54
o
You should now be left
with 36
o
Again, turn the protractor so that zero is now
on this line
Again, turn the
protractor
Lightly, draw a vertical
line through the centre
Please note that due to the limitations of
the software some measurements on this
screen are not totally accurate.
How do I draw a pie chart?
Step4
It may be necessary to work
out the percentage and
include this in the labelling.
How would we do this?
To calculate degree share,
you need to divide the
share that the category
has by the total units and
then multiply by 100 (the
whole circle is equal to
100%).
E
x
e
r
c
i
s
e
s
Use a pie chart to illustrate the data given below, fully label
the chart and show the percentage value of each sector.
180 FE college students were asked what they intended to
do next year.
E
x
e
r
c
i
s
e
s
At a concert, the ages of 115 people were recorded as:
Draw a pie chart
using this data,
give the data
labels values in
% ages
Thirty people were surveyed in a shopping
centre and asked their ages. These are
displayed below.
54
41
65
46
66
37
32
71
34
73
15
26
64
22
54
8
58
43
14
57
43
52
24
68
43
39
59
35
48
49
a)
Draw a tally-frequency table.
b)
Using the data in your frequency table, construct a table
to calculate the angles in a pie chart.
c)
draw and fully labelled a pie chart to show the
percentage values.
This is a step by step guide to creating a pie chart
Legislative process, including key terms like amendment, appropriation, bill numbering, chamber, committee of the whole, and more. Gain an understanding of how bills become laws in the Kansas Legislature."

Download Presentation

Please find below an Image/Link to download the presentation.
The content on the website is provided AS IS for your information and personal use only. It may not be sold, licensed, or shared on other websites without obtaining consent from the author.If you encounter any issues during the download, it is possible that the publisher has removed the file from their server.
You are allowed to download the files provided on this website for personal or commercial use, subject to the condition that they are used lawfully. All files are the property of their respective owners.
The content on the website is provided AS IS for your information and personal use only. It may not be sold, licensed, or shared on other websites without obtaining consent from the author.
E N D
Presentation Transcript
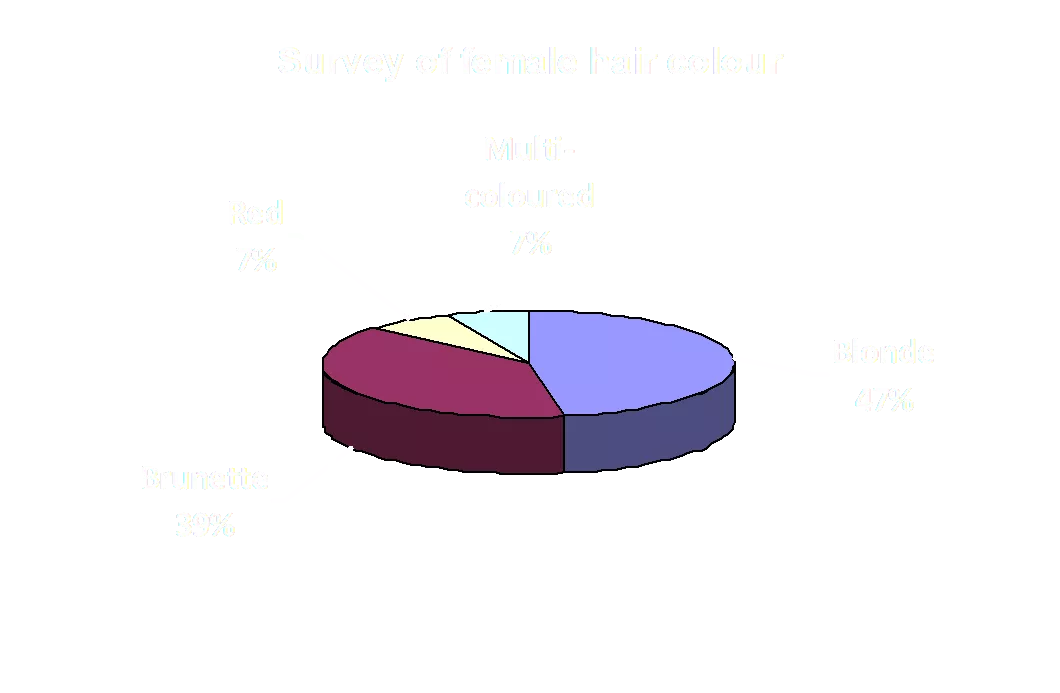
Creating and Understanding Pie Charts
What is a Pie Chart? Survey of female hair colour Multi- coloured 7% Red 7% Blonde 47% Brunette 39% A pie chart is a circular chart (pie-shaped); it is split into segments to show percentages or the relative contributions of categories of data.
How do I draw a pie chart? Step 1 Decide on the total number of categories. In other words, identify the categories that you will use. Collect the data so the number per category can be counted (Frequency Table) 1. 2. Brand Name Daz Ariel Bold Fairy Other Tally Frequency 40 |||| |||| |||| |||| |||| |||| |||| |||| 60 |||| |||| |||| |||| |||| |||| |||| |||| |||| |||| |||| |||| |||| |||| |||| |||| |||| |||| |||| |||| |||| |||| 50 |||| |||| |||| |||| |||| 30 20 |||| |||| |||| |||| TOTAL 200
How do I draw a pie chart? Step 2 Brand Name Units sold / year in 106 Degree Share To calculate degree share, you need to divide the share that the category has by the total units and then multiply by 360 (there are 360 degrees ( ) in a circle). 40 Daz 40 x 360 = 72o 200 60 Ariel 60 x 360 = 108o 200 50 Bold 50 x 360 = 90o 200 30 Fairy 30 x 360 = 54o 200 20 Other 20 x 360 = 36o 200 Total 200 Total = 360o
How do I draw a pie chart? Step 3 Drawing the chart Lightly, draw a vertical line through the centre 1st Draw a Circle With a protractor measure 72o Mark this angle and draw a line from the centre to the mark You should now be left with 36o And finally 54o Turn the protractor so that the zero is now on this line Again, turn the protractor Now measure 108o Now measure 90o Please note that due to the limitations of the software some measurements on this screen are not totally accurate. Again, turn the protractor so that zero is now on this line
How do I draw a pie chart? Step4 It may be necessary to work out the percentage and include this in the labelling. How would we do this? Units sold / year in 106 Brand Name % age (40 200) x 100 = 20% (60 200) x 100 = 30% (50 200) x 100 = 25% (30 200) x 100 = 15% (20 200) x 100 = 10% Daz 40 Ariel 60 To calculate degree share, you need to divide the share that the category has by the total units and then multiply by 100 (the whole circle is equal to 100%). Bold 50 Fairy 30 Other 20 Total 200
Market share of soap powder brands Other 10% Daz 20% Fairy 15% Ariel 30% Bold 25%
Exercises Use a pie chart to illustrate the data given below, fully label the chart and show the percentage value of each sector. 180 FE college students were asked what they intended to do next year. 54 Going to university 40 Staying at college 62 Going into employment 24 No firm intention
Exercises At a concert, the ages of 115 people were recorded as: Under 20 15 Draw a pie chart using this data, give the data labels values in % ages 20 - 29 30 30 - 39 22 40 - 59 24 60 and over 24
Thirty people were surveyed in a shopping centre and asked their ages. These are displayed below. 54 41 65 46 66 37 32 71 34 73 15 26 64 22 54 8 58 43 14 57 43 52 24 68 43 39 59 35 48 49 a) Draw a tally-frequency table. b) Using the data in your frequency table, construct a table to calculate the angles in a pie chart. c) draw and fully labelled a pie chart to show the percentage values.