Impact of Stress and Exercise on Body Weight and Food Intake in Rats
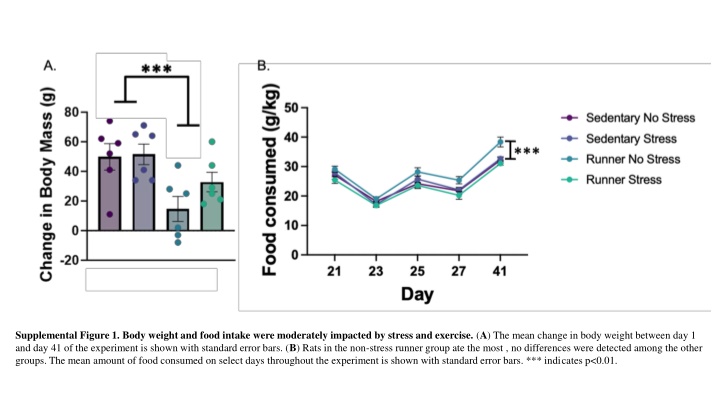
Body weight and food intake in rats were moderately influenced by stress and exercise in this experiment. The results showed differences in body weight change and food consumption among groups. Microglial metabolism and inflammatory changes were also examined, revealing consistent exercise-specific clusters across individuals and groups. Furthermore, individual running distance was found to impact gene expression differently. ANCOVA and 2x2 analyses highlighted significant genes related to stress, exercise, and running levels. Overall, the study sheds light on the complex interplay between stress, exercise, and metabolic responses in rats.
Download Presentation

Please find below an Image/Link to download the presentation.
The content on the website is provided AS IS for your information and personal use only. It may not be sold, licensed, or shared on other websites without obtaining consent from the author.If you encounter any issues during the download, it is possible that the publisher has removed the file from their server.
You are allowed to download the files provided on this website for personal or commercial use, subject to the condition that they are used lawfully. All files are the property of their respective owners.
The content on the website is provided AS IS for your information and personal use only. It may not be sold, licensed, or shared on other websites without obtaining consent from the author.
E N D
Presentation Transcript
Supplemental Figure 1. Body weight and food intake were moderately impacted by stress and exercise. (A) The mean change in body weight between day 1 and day 41 of the experiment is shown with standard error bars. (B) Rats in the non-stress runner group ate the most , no differences were detected among the other groups. The mean amount of food consumed on select days throughout the experiment is shown with standard error bars. *** indicates p<0.01.
Supplemental Figure 2. Pairwise comparisons of microglial metabolism and inflammatory changes. Analysis of the metabolism, M1 (pro-inflammatory), and M2 (anti-inflammatory) activation states of microglia did not show subcluster or treatment group differences between the no stress (NS_Sed) and stress (S_Sed) groups (A-C) or the sedentary (NS_Sed) and exercise (or exercise enrichment) (NS_Run) groups (D-F).
Supplemental Figure 3. Exercise-enrichment cluster is consistent across individuals and groups. (A) Subset and re-clustering of microglia between no stress runners (NS_Run) and no stress sedentary (NS_Sed) across individuals shows the consistent presence of a cluster specific to exercise (subcluster 3). (B) The presence of a subcluster associated with exercise is even present across all four groups with the no stress runners and stress runners (S_Run) showing the presence of a subcluster that is not present in either of the sedentary groups.
Supplemental Figure 4. Individual running distance impacts gene expression. Analysis of the difference in significant numbers of DEGs in the NS_Run/NS_Sed analysis and the individual total running distance analysis shows a very low amount of overlap that was no statistically significant (A) with examples of genes that were highly correlated with running distance plotted (B).
Supplemental Figure 5. Comparison of ANCOVA, 2x2, total running, and no stress versus stress analyses. The no stress versus stress analysis shared 19 significant genes with the main effect of stress in the 2x2 analysis (A). The sedentary versus runner and main effect of exercise in the 2x2 analysis shared 185 significant genes (B). The main effect of stress in the ANCOVA and the no stress versus stress analysis shared 1 significant gene (C). The ANCOVA for individual total running levels shared 303 significant genes with the total running analysis (D). Examples of genes ANCOVA genes that were significant for the main effect of total individual running level (E), stress (F), and the interaction (G) are shown.
Supplemental Figure 6. Overlapping DEGs between stress and exercise. (A) Eight genes were identified as overlapping between the analyses measuring the effects of stress and exercise on gene expression.
