Impact of Macroeconomic Information on Stock Prices
Relationship between macroeconomic information shocks and stock prices. Discover how unexpected news and investor expectations influence market dynamics, leading to changes in stock valuations. Gain insights into the interplay between economic news, trading motivations, and market behavior.

Download Presentation

Please find below an Image/Link to download the presentation.
The content on the website is provided AS IS for your information and personal use only. It may not be sold, licensed, or shared on other websites without obtaining consent from the author.If you encounter any issues during the download, it is possible that the publisher has removed the file from their server.
You are allowed to download the files provided on this website for personal or commercial use, subject to the condition that they are used lawfully. All files are the property of their respective owners.
The content on the website is provided AS IS for your information and personal use only. It may not be sold, licensed, or shared on other websites without obtaining consent from the author.
E N D
Presentation Transcript
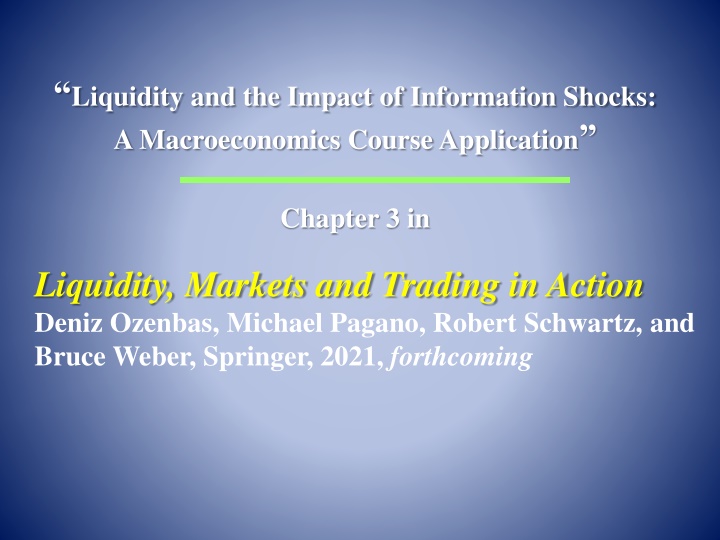
Liquidity and the Impact of Information Shocks: A Macroeconomics Course Application Chapter 3 in Liquidity, Markets and Trading in Action Deniz Ozenbas, Michael Pagano, Robert Schwartz, and Bruce Weber, Springer, 2021, forthcoming
The Important Role of Macroeconomic Information Shocks A macroeconomics course has many elements that cover key decisions by consumers, producers, investors, and governments related to consumption, investment, saving, interest rates, taxes, etc. We consider here how information shocks in the macroeconomy can affect financial markets, and vice versa, by changing investor s expectations Slide 2
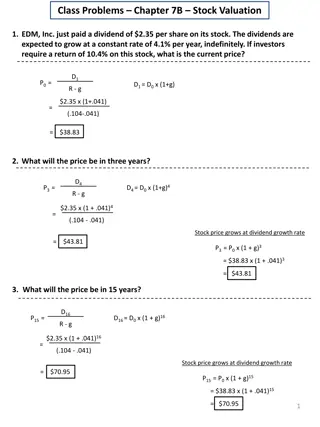
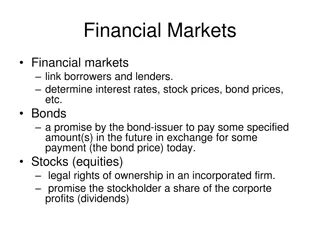
How the Macroeconomy affects Stock Prices The Intrinsic or Fundamental Market Value of a firm s stock can be calculated as the sum of the firm s future free cash flows to shareholders (FCFequity) discounted at the shareholders required return (Requity). This value (V0) can be estimated as follows: V0 = t = 1 FCFequity,t (1 + Requity)t Slide 3
How the Macroeconomy affects Stock Prices (cont.) The key stock valuation variables (FCFequityand Requity) are affected by news about many Macroeconomic factors such as: Real GDP Growth & Inflation Employment & Wage Growth Personal Consumption and Saving Capital Investment Taxes & Government Spending Interest Rates & Exchange Rates These macro factors are driven via choices by: Consumers, Businesses, Investors, and Government Slide 4
What Motivates Trading? 1. 2. New information (unexpected news) Divergent Expectations (people agree to disagree due to new information) Liquidityneeds ( uninformed traders) Technical( noise ) trading 3. 4. So Unexpected News about the economy can lead to a large amount of trading which can then affect everyone s economic decisions, which then again affects trading, etc., in an interactive feedback loop Slide 5
An Example of how Macro Shocks affect Stock Prices 1. News of unexpectedly strong data on Consumer Spending and the Purchasing Managers Index from last month leads to an increase in investor optimism 2. More optimistic investors then revise upwards their expectations of future corporate cash flows and are willing to take more risk 3. Better expectations about future cash flows cause fundamental values to rise above current market prices for stocks 4. Investors then place orders to buy stocks and push up market prices towards their new, higher fundamental values but have to deal with market frictions like divergent expectations, price impact, volatility 5. Equilibrium occurs in the stock market and buy orders stop being submitted once market prices are equal to fundamental values Slide 6
Main Components of Total Output (Real GDP) FRED Graph Total Output = Y = C + I + G + NX Slide 7
U.S. Unemployment Rate is volatile (but lagging) FRED Graph Slide 8
U.S. Investment is volatile and leads Real Output FRED Graph Slide 9
U.S. Investment, Corporate Profits, & Stock Prices are Positively Correlated FRED Graph Slide 10
The Business Cycle, Interest Rates, and Interactive Feedback Loops Individual decisions by Consumers, Businesses, Investors, and Government lead to fluctuations in GDP and the demand for money to create Business Cycles Interest Rates and Prices respond to these fluctuations and move upward during an economic Boom and downward during a Bust Changes in Interest Rates are a key Signal of Macro conditions that all players must follow. Slide 11
Stylized View of the Business Cycle Slide 12
Vicious vs. Virtuous Business Cycles Virtuous Cycle: when positive economic factors reinforce each other, e.g., Strong Employment => More Consumer Spending => Larger Bus. Profits => Increased Bus. Investment => Further Employment Gains Vicious Cycle: when negative economic factors reinforce each other, e.g., Weak Employment => Less Consumer Spending => Smaller Bus. Profits => Decreased Bus. Investment => Further Employment Losses Slide 13
Possible Reactions to Interest Rate Signals When long-term interest rates rise because of a virtuous cycle: Investors shift more money into the stock market and out of the bond market Businesses and Consumers are both confident and spend more Fed might want to avoid over-heating by and raising Fed Funds rate and selling Treasurys via OMO in financial markets Slide 14
Reactions to Interest Rate Signals (cont.) When long-term interest rates fall because of a vicious cycle: Investors shift money out of the stock market and into the bond market Businesses and Consumers are both nervous and spend less Fed might want to reverse any cooling-off by lowering Fed Funds rate and buying Treasurys via OMO in financial markets Slide 15
Business Cycles & Government Actions Monetary Policy is controlled by the Federal Reserve which has two competing goals: Stimulate healthy economic growth, and Control inflation at a manageable level. Primary tools are the Fed Funds rate and Open Market Operations Fiscal Policy is controlled by the Federal Government which has three key tools: Discretionary government spending (e.g., Covid-related CARES Act, infrastructure, military), Ability to enact new taxes (to increase Govt. Revenue), and Automatic Stabilizers (e.g., income taxes, unemployment benefits). Slide 16
The Interest Rate Cycle & Yield Curve Yield Curve can be a Leading indicator of both the Stock Market and Economy. Federal Reserve sets short-term rates but Long-term rates are set by investor expectations of economic growth and inflation. Bonds and Money Market instruments can be competitors to Stocks, so investors shift between them depending on the direction of interest rates. Slide 17
Interest Rate Cycle & Yield Curve (cont.) The Slope of the Yield Curve (YC) can help Investors, Businesses, Consumers, and the Government plan for the future: Normal Upward Slope: Middle Bull Market Steep: New Bull Market Inverted: Bearish Stock Market Flat YC (no slope): Mixed (Neither Bull nor Bear) Slide 18
An Example of How to Use Interest Rate Signals: Sector Rotation in the Stock Market Stock Market is a leading economic indicator based on the slope of Yield Curve (which leads economy and stocks). Different Industry Sectors shine at various points during the business cycle and different stages of the market, e.g., Stage of Market Bull Market Bear Market Early Transportation (Steep Yield Curve) Consumer Staples (Inverted Yield Curve) Middle Capital Goods (Normal Yield Curve) Utilities Late Commodities Consumer Cyclicals Slide 20
The Need for Financial Markets in a Macroeconomy Investors use financial markets to express their expectations about future economic conditions and stock prices Financial markets can help investors by providing liquidity that ensures trades occur quickly, at low cost, and at reliable, or fair, prices So financial markets should be structured to provide liquidity as efficiently as possible Slide 21
Main Types of Financial Markets Transparency Immediacy Trading Costs Volatility Order-driven (limit order book) Quote-driven (dealer) Call Auction Dark Pool Slide 22
Order Driven Market Public Seller 10:50 10:55 11:00 The limit order book brings buyer& seller together Places a Buy Limit Order Limit Order Executes Public Buyer Slide 23
The Limit Order Book BIDS PRICE 11.30 11.25 11.20 11.15 11.10 11.05 11.00 10.95 OFFERS 91 0 52 24 7 Air Pocket Bid Ask Spread (10.95 - 11.10) 35 70 0 20 67 39 46 10.90 10.85 10.80 10.75 10.70 10.65 Air Pocket Slide 24
Dealer Intermediation Dealer Sells Public Seller 10:50 10:55 11:00 Dealer provision of immediacy brings buyer & seller together Public Buyer Dealer Buys Slide 25
A Call Auction Public Seller 10:50 10:55 11:00 A meeting point in time can bring multiple buyers & sellers together Public Buyer Slide 26
Call Matches Cumulated Buy & Sell Orders CUMULATED SELL ORDERS O Price 52 O 51 50 49 O P* = 50 O 48 O CUMULATED BUY ORDERS 47 1 2 3 4 5 6 Orders 3 Slide 27
Price & Quantity Discovery The most important objective of any financial market is to foster accurate price and quantity discovery Much demand is latent participants do not readily reveal their desires to buy or to sell Traders instinctively know the price discovery problem. That is why technical analysis is widely used Slide 28
Price Discovery is Difficult because Investors: Cannot assess share values with precision Have divergent expectations Have adaptive valuations that react to news Do analysts ever agree? Slide 29
Divergent Expectations & Price Determination V(HI) = $30: The Bulls k percent What price(s) will prevail for ABC s stock? V (LO) = $20: The Bears 1-k percent Answer: It depends on k which will vary depending on news about the economy and ABC s fundamental value. Slide 30
Technical Analysis Dynamic Price Discovery due to: Large, complex information set Divergent expectations and Adaptive valuations Fundamental Analysis can identify what stock to buy or sell Technical Analysis can identify when to buy or sell a stock Slide 31
Example of Technical Analysis This graph includes 2 sets of Trend Lines, a 65-day Moving Average, & a 14-day Relative Strength Indicator (bottom graph) to identify any gap up and gap down patterns Slide 32
Some Technical Analysis Techniques Moving Averages MACD and Cross-overs Trendlines and Break-outs Relative Strength (RSI) Stochastics / Oscillators Pattern Recognition (e.g., head & shoulders , pennants , etc.) Point and Figure charts Candlestick charts Volume and Market Breadth Money Flow statistics Slide 33
Wrap-Up We showed the linkages between Macroeconomic conditions, Interest Rates, and Stock Prices Demonstrated that unexpected news and the stage of the business cycle can influence stock prices Explained how important financial markets are for Investors, Businesses, Consumers, and Governments to provide an interactive feedback loop with the economy We also showed the importance of understanding the types of financial markets (order-driven vs. quote-driven vs. call auctions) Described how to combine technical and fundamental analysis to decide when to trade Slide 34
Bonus Slide: Key Theories of the Business Cycle Classical / Neo-Classical / Rational Expectations: Adam Smith s invisible hand and the power of market signals Keynesianism: J.M. Keynes s helping hand of government Monetarisim: Friedman s money growth => inflation (ultimately) Real Business Cycle: productivity shocks are key to growth Stylized Business Cycle Model: Business => Investment => { Interest Rates / Employment / Technology} => Consumption => Business Slide 35


")
")


")


")
")