Impact of Corruption on Happiness Among Palestinian Workers in Israel
Explore the relationship between corruption and happiness among Palestinian workers in Israel through a priming experiment, shedding light on the effects of exploitative work permits and potential disappointment towards authorities. The study reveals a negative impact on subjective well-being, particularly for those who have encountered corrupt transactions, offering valuable insights into the complex dynamics affecting migrant workers' happiness.

Download Presentation

Please find below an Image/Link to download the presentation.
The content on the website is provided AS IS for your information and personal use only. It may not be sold, licensed, or shared on other websites without obtaining consent from the author. Download presentation by click this link. If you encounter any issues during the download, it is possible that the publisher has removed the file from their server.
E N D
Presentation Transcript
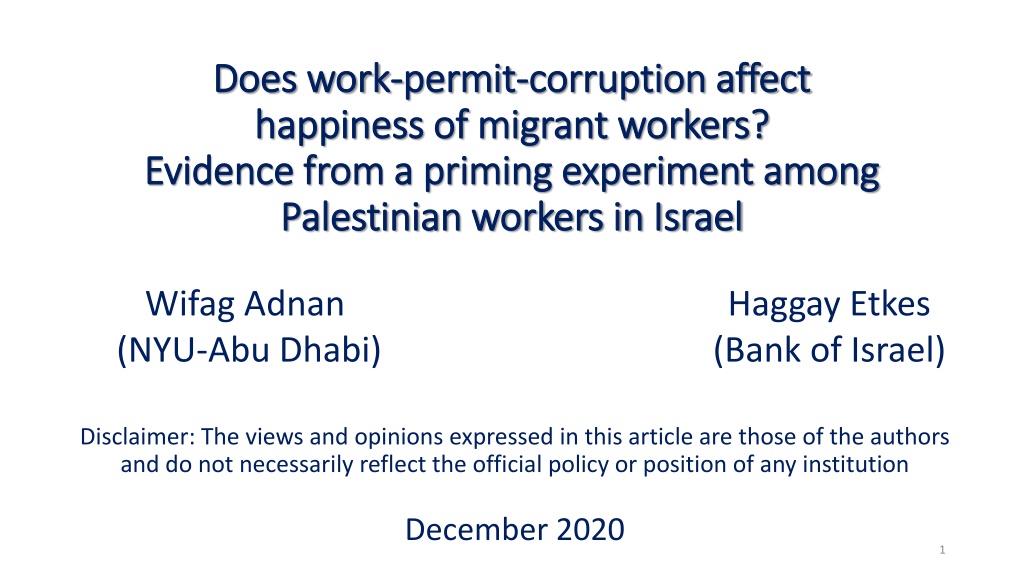
Does work Does work- -permit happiness of migrant workers? happiness of migrant workers? Evidence from a priming experiment among Evidence from a priming experiment among Palestinian workers in Israel Palestinian workers in Israel permit- -corruption affect corruption affect Wifag Adnan (NYU-Abu Dhabi) Haggay Etkes (Bank of Israel) Disclaimer: The views and opinions expressed in this article are those of the authors and do not necessarily reflect the official policy or position of any institution December 2020 1
Does corruption affect happiness? Does corruption affect happiness? Happiness - Subjective well being (SWB): Overall, on a scale of 1 to 10, how satisfied are you with your life nowadays? (1 is Very Unsatisfied and 10 is Very Satisfied) Corruption could directly affect SWB of: People who personally experience corrupt transactions People who observe corrupt transactions We embedded a priming experiment in a survey (N=1,260) and tested whether a question on the exploitative work permit trade affects SWB of Palestinian workers in Israel. The treatment Q reduced SWB by 0.27 (~5%). Greater impact on workers who paid in the past for a permit (-0.7). Most of the decline in SWB comes from treated who believe that the authorities can reduce exploitation and may represent disappointment due to lack of effective action. 2
Outlines Outlines Literature The black market for work permits in israel Happiness in MENA and the Palestinian Authority The experiment and data collection Balancing tests Main results Possible mechanism Conclusion 3
Relevant literature Relevant literature Negative association between SWB and corruption Country level panel analyses: Welsch (2008); Mookerjee & Beron (2005); Layard et al. (2012); Arvin & Lew (2014) only for high income country; Lin & an (2020) Household / individual level analyses: Tavits (2008); Yan & Bo (2020) We are not familiar with causal evidence for the impact of corruption on happiness. Political implications of corruption and happiness (MENA) Witte et al. (2018) life dissatisfaction is positively associated with peaceful uprising Gholipour et al. (2013) - poor governance adversely affect happiness in MENA Arampatzi et al. (2018) - MENA citizens had low SWB and concerns about corruption contributed to the low SWB before the Arab Spring . 4
Hamas aims to Hamas aims to leverage the work leverage the work- - permit kickbacks permit kickbacks Permit brokers the hand of the occupation embezzles thousands of Palestinian workers and waists their money Felesteen Newspaper, November 6, 2020 5
The black market for work permits in Israel The black market for work permits in Israel Until December 2020, work permits in Israel for Palestinian were requested by Israeli employers / sponsors, who could easily revoke them. Some sponsors, whose permit quota exceeded their need for a permit, sold the permit to workers. Paying workers sought employment in the informal market in Israel. 2018 2019 Source Adnan & Etkes ILO Workers who paid for the permit 20,000 42,501 Permit price per month NIS 1,987 USD 550 NIS 2,439 USD 690 Annual revenues NIS 480 M USD 120 M NIS 1.2 Bn USD 338 M Annual profits NIS 122 M USD 35 M NIS 427 M USD 119 M 6
Happiness in MENA and the Palestinian Authority Happiness in MENA and the Palestinian Authority Happiness index of Palestinian in Israel workers by treatment by employer (October 2020) Happiness index in selected MENA societies, 2019 Authors commissioned survey (October 2020) World Happiness report (2019) 7
Happiness index of Palestinian workers by workplace and paying for a permit (October 2020) Causal? Authors commissioned survey (October 2020) 8
Association between SWB and paying for a permit in August 2020 Association between SWB and paying for a permit in August 2020 ????= ? ???? ?? ????+ ??+ ? Table H: regression estimates of the association between SWB and paying for a permit among employed in Israel in August 1 2 3 4 5 Implied monetary compensation for paying for a permit 0.36/0.31~ NIS 118 Paid for a permit in August Employed in the WB in August Daily wage in August (NIS 100) Daily wage in August net of permit price (NIS 100) Observations R-squared F. E. for districts Controlling for age, schooling, employment in IL / WB during August Controlling for employment time and wage in August 2020 -0.679** (0.213) 0.350 (0.259) -0.757*** (0.184) 0.372 (0.255) -0.768*** (0.211) 0.345 (0.243) -0.957*** (0.219) 0.716** (0.243) 0.411*** (0.104) -0.366 (0.241) 0.638** (0.260) 0.309*** (0.073) 683 0.114 V V 685 0.011 685 0.033 V 685 0.070 V V 685 0.119 V V V V Base group: Non-payers employed only in IL 9
The experiment The experiment We designed a priming experiment testing whether a question on the exploitive permit-trade affects SWB of Palestinian workers in Israel. The assignment to treatment and control groups By the researchers for individuals interviewed for the second time based on data collected in the June round. By the polling company for individuals interviewed for the first time in October Almost half of these workers illegally paid about 20% of their wage for their work permit in January-February, April-May or August 2020. Treatment Q: The authorities launched a campaign against the exploitation and the permit brokers harming Palestinian workers in Israel. What is the expected effect of this policy? . ... 10
The treatment question The treatment question Replies to the treatment question (N=644) Treatment Q: The authorities launched a campaign against the exploitation and the permit brokers harming Palestinian workers in Israel. Do you think these efforts: A. Will reduce the exploitation of workers B. Will benefit Israeli firms C. Will neither affect workers nor firms D. Are not genuine and aimed to cover up corruption 11
Timeline, 2020 Timeline, 2020 Second Shutdown 18/9-1/11 First Shutdown 25/3-17/5 Aug Sep Nov Jul Oct May Jun Apr Jan Mar Feb Second Round + Experiment (N=1,263) First Round (N=1,263) After the first Shutdown Before the first Shutdown During the first Shutdown Attrition (N=380) Old sample (N=883) New sample (N=380) 12
Data Data Phone survey conducted by Palestinian Center for Public Opinion (PCPO) designed to follow Palestinian employment in Israel during COVID19. Round 1 (May-June 2020) Workers were interviewed about employment in Israel in January-February 2020 and during the first shutdown in Israel (mid March-mid May 2020) including on payment for permits 1,263 Palestinian workers employed in Israel in January-February 2020 Round 2 (October 2020) the experiment Workers were interviewed about employment in Israel in August 2020 and between the two shutdowns in Israel and about SWB Old sample - respondents to R1 were divided by the researchers to equal size and balanced treatment and control groups. Yet only 883 (out of 1,263) workers interviewed to R2 New sample - 380 workers were allocated to treatment and control by the polling company Total sample 1,263 workers: treated 644 workers and control 619 workers 13
Design of the October survey Design of the October survey (Second round) (Second round) Workers, who paid for a permit in August, were asked first on this payment and then had the treatment Q The treatment included only mentioning the campaign against the exploitative permit-trade before asking on SWB Workers, who did not pay for a permit in August, were asked about the exploitation only in the treatment Q The treatment included both reminding the permit-trade and mentioning its exploitative nature before asking on SWB Demographics Employment in the WB and Israel in August Paid for a permit in August? Yes No Details on the payment Strong treatment Weak treatment Treatment group Yes Treatment Q No Subjective well being 14
Taxonomy of the sample Taxonomy of the sample Full sample (1,263 obs) Weak treatment Strong treatment Did not pay for a permit in August (1,017 obs) Paid for a permit in August (246 obs) Did not pay for a permit in Jan 2020 (412 obs) Unknown whether paid for a permit in Jan 2020 (319 obs) Paid for a permit in Jan 2020 (286 obs) Did not participate or report in round 1 15
Table A: Balancing tests: demographics and employment in August 2020 Table A: Balancing tests: demographics and employment in August 2020 Full Sample Control 35.4 (8.9) 0.40 (0.49) 0.23 (0.42) 0.20 (0.40) 0.58 (0.49) 0.80 (0.40) 41.17 (0.40) 16.3 (5.8) 341.4 (117.4) 0.45 (0.50) 2,405.7 412.4 5.21 (3.38) 619 Old Sample Control 36.2 (9.0) 0.39 (0.49) 0.22 (0.41) 0.21 (0.41) 0.56 (0.50) 0.81 (0.39) 41.09 (0.39) 16.2 (5.7) 329.4 (111.4) 0.42 (0.49) 2,366.1 385.5 5.22 (3.37) 441 New Sample Control 33.6 (8.3) 0.42 (0.50) 0.25 (0.44) 0.16 (0.37) 0.63 (0.48) 0.77 (0.42) 41.35 (0.42) 16.3 (5.9) 368.0 (126.1) 0.54 (0.50) 2,484.1 455.4 5.18 (3.41) 177 Treatment 36.5 (9.4) 0.43 (0.50) 0.22 (0.41) 0.23 (0.42) 0.51 (0.50) 0.80 (0.40) 41.71 (0.40) 15.9 (5.8) 339.8 (113.4) 0.45 (0.50) 2,383.2 423.2 4.90 (3.28) 644 Difference Treatment 1.01** (0.4) 0.02 (0.03) -0.01 (0.02) 0.03 (0.02) -0.07** (0.03) 0.00 (0.02) 0.54 (0.02) -0.4 (0.5) -1.6 (5.8) -0.01 (0.04) -22.5 34.5 -0.31** (0.12) Difference Treatment 0.5 (0.8) 0.02 (0.03) 0.01 (0.02) 0.00 (0.02) -0.03 (0.04) 0.00 (0.03) 0.75 (0.03) -0.4 (0.5) 18.5** (7.3) 0.05 (0.04) 19.2 45.9 -0.29 (0.21) Difference 2.6** (1.1) 0.03 (0.05) -0.06 (0.05) 0.10*** (0.03) -0.15*** (0.04) 0.00 (0.09) 0.04 (0.09) -0.3 (1.1) -47.8*** (9.9) -0.15** (0.05) -107.3 65.2 -0.36* (0.19) . Demographics Age 36.6 (9.2) 0.41 (0.49) 0.23 (0.42) 0.21 (0.41) 0.53 (0.50) 0.81 (0.40) 41.84 (0.40) 15.9 (5.7) 347.9 (112.1) 0.47 (0.50) 2,385.3 448.3 4.93 (3.22) 442 36.2 (9.9) 0.45 (0.50) 0.19 (0.39) 0.26 (0.44) 0.47 (0.50) 0.77 (0.42) 41.40 (0.42) 15.9 (5.9) 320.2 (114.6) 0.39 (0.49) 2,376.8 343.0 4.82 (3.40) 203 Secondary Education Post Secondary Education Employment During August 2020. Employed in the West Bank Employed in Israel Employment in Israel During August 2020 (Only workers who were employed in Israel) Construction in Israel Working hours per week Working days per month Daily Wage Paid for a work permit Permit price Subjective well being Observations ** 5% significance; *** 1% significance Significance is estimated with clustering for districts 16
Balancing tests of the old sample: employment before and Balancing tests of the old sample: employment before and during the shutdown (Jan during the shutdown (Jan- -Feb and March 23 Feb and March 23- -May 15 2020) May 15 2020) Did not pay for a permit before the shutdown Treatment Control 0.73 0.74 (0.45) (0.44) 42.9 43.6 (10.0) (9.8) 19.6 20.0 (4.3) (3.9) 296.1 292.3 (95.0) (88.7) Paid for a permit before the shutdown Treatment Control 0.76 0.82 (0.42) (0.39) 41.2 42.7 (11.3) (10.7) 18.9 19.4 (4.2) (4.0) 376.9 385.6 (98.0) (107.8) 2,382.2 2,417.9 (433.1) (361.0) 0.19 0.17 (0.40) (0.37) 0.81 0.84 (0.39) (0.37) 41.40 43.55 (11.55) (14.73) 16.7 15.2 (6.4) (6.4) 409.5 407.4 (123.3) (139.0) 0.15 0.11 (0.36) (0.31) 2,334.4 2,309.5 (494.9) (555.8) 217 193 Full Old Sample Treatment 0.75 (0.44) 42.1 (10.7) 19.2 (4.3) 336.2 (104.5) Control 0.77 (0.42) 43.2 (10.2) 19.7 (3.9) 334.1 (108.1) Difference -0.03 (0.02) -1.1** (0.6) -0.5* (0.2) 2.1 (3.1) Difference -0.05 (0.03) -1.5** (0.7) -0.5** (0.2) -8.8 (8.3) -35.7 (54.0) 0.03 (0.04) -0.02 (0.09) -2.15 (2.74) 1.6 (0.9) 2.1 (33.1) 0.04** (0.02) 24.9 (101.8) Difference -0.01 (0.04) -0.7 (0.8) -0.4 (0.5) 3.8 (5.4) Employment Construction in Israel in Israel Before the Working hours per week Shutdown (Jan.-Feb. Working days per month 2020) Daily Wage Permit price Employed in Israel 0.23 (0.42) 0.78 (0.42) 42.34 (12.69) 17.3 (7.3) 356.6 (125.3) 0.22 (0.41) 0.82 (0.39) 44.13 (14.42) 16.9 (7.2) 351.7 (121.1) 0.01 (0.03) -0.04 (0.05) -1.79 (2.63) 0.4 (0.6) 4.9 (15.6) 0.25 (0.44) 0.75 (0.43) 43.05 (13.54) 17.7 (8.0) 316.7 (112.1) 0.22 (0.42) 0.81 (0.40) 44.48 (14.37) 18.0 (7.4) 318.6 (96.0) 0.03 (0.04) -0.05 (0.07) -1.43 (2.54) -0.2 (0.8) -1.9 (14.7) Employment Construction in Israel in Israel During Working hours per week the Shutdown (March-May Working days per month 2020) Daily Wage Paid for a work permit Permit price Observations 441 442 221 238 ** 5% significance; *** 1% significance Significance is estimated with clustering for districts 17
Main results Main results ????= ? ??????????+ ??+ ? Full sample -0.27*** (1,263 obs) Weak treatment Strong treatment Did not pay for a permit in August -0.39*** (1,017 obs) Paid for a permit in August +0.09 (246 obs) Did not pay for a permit in Jan 2020 -0.17 (412 obs) Unknown whether paid for a permit in Jan 2020 -0.35 (319 obs) Paid for a permit in Jan 2020 -0.70*** (286 obs) Did not participate or report in round 1 18
Main results are stable in various specifications Main results are stable in various specifications ????= ? ??????????+ ??+ ? 1 2 3 4 Old and new sample -0.309** -0.317** (0.125) (0.119) 1,263 0.002 Old sample -0.292 (0.174) 868 0.066 Full sample Treatment Effect -0.270** (0.081) 1,263 0.058 Observations R-squared 1,263 0.009 Did not pay for a permit in in August Treatment Effect -0.363** (0.131) 1,017 0.003 -0.394** (0.124) 1,017 0.010 -0.368*** (0.095) 1,017 0.076 -0.388 (0.231) 697 0.078 Observations R-squared Did not pay for a permit in in August but did pay in January-February Treatment Effect -0.496* (0.221) 286 0.006 -0.547** (0.232) 286 0.030 -0.699*** (0.194) 286 0.145 -0.630** (0.235) 286 0.161 Observations R-squared F. E. for districts Controlling for age, schooling, employment in August Controlling for employment time and wage in IL during January-February V V V V V V 19
Results are not driven mainly by workers who paid for a permit Results are not driven mainly by workers who paid for a permit before the shutdown before the shutdown ????= ?1 ??????????+ ?2 ?????+ ?3 ????? ??????????+ ??+ ? Table H: Dif-in-Dif specification allowing difference treatment effect for payers before the shutdown 1 2 3 4 Treatment -0.363** (0.131) -0.303** (0.117) -0.232 (0.264) -0.193 (0.190) -0.342** (0.102) -0.285 (0.270) -0.167 (0.192) -0.265** (0.106) 0.047 (0.262) -0.363 (0.206) Paid for a permit Before the shutdown Treatment*Paid for a permit Before the shutdown Observations R-squared 1,017 0.003 1,017 0.005 1,017 0.012 1,017 0.077 F. E. for districts Controlling for age, schooling, employment in IL / WB during August V V V 20
Association between SWB in October and Association between SWB in October and the value of payment for a permit in January the value of payment for a permit in January- -February 2020 ??? (???)?= ?1 ??????????+ ?2 ?????????? ??????? ??? ????+?3 ?????????? ????(??? ???)? +?4 ??????? ??? ????+ ?5 ????(??? ???)?+ ??+ ? February 2020 Table K: regression estimates of the association between SWB and value of payment for a permit among treated who were employed in Israel in January-February 1 2 3 4 1 Treatment -1.495* (0.712) -0.250 (0.141) 0.236* (0.113) -0.047 (0.145) -0.018 (0.080) 868 0.018 -1.454* (0.711) -0.266 (0.150) 0.235* (0.115) -0.070 (0.147) -0.020 (0.080) 868 0.020 V -1.597** (0.673) -0.286* (0.149) 0.249** (0.106) -0.043 (0.152) -0.031 (0.076) 868 0.031 V V -1.663** (0.714) -0.260 (0.152) 0.254* (0.112) -0.027 (0.142) -0.041 (0.078) 868 0.041 V V 2 Treatment*Permit Price Before Shutdown (NIS 000) Treatment*Monthly Wage Before Shutdown (NIS 000) Permit Price Before Shutdown (NIS 000) Monthly Wage Before Shutdown (NIS 000) Observations R-squared F. E. for districts Controlling for age, schooling, employment in IL / WB during August F.E. for age 3 4 5 V 21 Base group: Non-payers employed only in IL
Association between SWB in October Association between SWB in October and value of payment for a permit in August 2020 and value of payment for a permit in August 2020 ????= ?1 ??????? ?? ????+ ?2 ??? ???? ?? ????+ ??+ ? Table J: regression estimates of the association between SWB and Value of payment for a permit among employed in Israel in August 1 2 3 4 Permit Price in August NIS 000 -0.333*** (0.092) 0.230*** (0.033) 685 0.052 -0.371*** (0.082) 0.238*** (0.032) 685 0.076 V -0.368*** (0.082) 0.256*** (0.033) 685 0.119 V V -0.482*** (0.081) 0.292*** (0.026) 685 0.212 V V Monthly Wage in August Observations R-squared F. E. for districts Controlling for age, schooling, employment in IL / WB during August F.E. for age V F-test (Permit Price+Monthly Wage=0) 0.27 0.11 0.18 0.03** Base group: Non-payers employed only in IL in August 22
Possible Mechanisms Possible Mechanisms The treatment: What is the expected impact of the authorities campaign? A. will reduce the exploitation of workers (68%) B. will benefit Israeli firms (2%) C. will neither affect workers nor firms (22%) D. are not genuine and aimed to cover up corruption (8%) We regress the interviewees expected impact of the fight against permit-brokers on SWB Workers who expected that the campaign could benefit workers reported significantly lower SWB than the control group and may reflect disappointment from the authorities failure to take action. Table E: impact of the experiment by interviewees perception of effect of fight against permit brokers 1 2 3 4 Old and new sample -0.459** -0.461** (0.144) (0.144) -0.894 -0.975 (1.016) (1.023) Old sample -0.389 (0.216) -1.386 (1.021) A. Efforts will reduce workers exploitation B. Efforts will benefit -0.403*** (0.108) -1.030 (1.058) Full sample employers C. No impact -0.066 (0.334) 0.508 (0.659) 1,263 0.006 -0.063 (0.324) 0.440 (0.673) 1,263 0.013 -0.004 (0.304) 0.380 (0.585) 1,263 0.062 -0.135 (0.279) 0.401 (0.517) 868 0.070 D. Efforts are not genuine Observations R-squared Did not pay for a permit in August A. Efforts will reduce workers exploitation B. Efforts will benefit -0.382** (0.140) -0.521 (1.141) -0.408** (0.141) -0.539 (1.162) -0.366** (0.109) -0.746 (1.217) -0.289 (0.235) -0.885 (1.249) employers C. No impact -0.492 (0.465) 0.248 (0.715) 1,017 0.004 -0.518 (0.445) 0.145 (0.730) 1,017 0.011 -0.462 (0.422) 0.015 (0.653) 1,017 0.076 -0.803* (0.400) 0.020 (0.533) 697 0.081 D. Efforts are not genuine Observations R-squared F. E. for districts Controlling for age, schooling, employment in August V V V V V Controlling for age, schooling, employment in IL / WB during August V 23
Tentative conclusions Tentative conclusions Cross section regression estimates of impact of paying for a permit in August: a decline of 0.366 in SWB (not statistically significant) We designed a controlled priming experiment on Palestinians, who worked in Israel in January-February 2020. The treatment: A question on the expected impact of theauthorities campaign against exploitation of the workers and permit brokers Average treatment effect: a decline of 0.27 (~5%) in SWB, equivalent to a decrease of about NIS 87 (25%) in the daily wage (slide 18) No effect of the treatment on payers in August probably due to survey design Significant treatment effect -0.39 (7.5%) on workers, who did not pay for a permit in August. Larger effect (-0.7) on workers who paid for a permit before COVID19 and is increasing with the payment personal experience of corruption may aggravate the adverse impact of corruption on SWB 24
Tentative conclusions (Cont.) Tentative conclusions (Cont.) The fixed and the variable parts of the The treatment had a large fixed impact on SWB in October regardless the permit price (slide 21) The decrease in October SWB, due to permit price before COVID19, was practically off set by the income before COVID19 only for the treated (slide 21). Association between SWB in October and permit price in August is somewhat larger than the association between SWB and income (slide 22). Possible mechanism the impact of the experiment is significant among workers who replied that the authorities could effectively fight corruption. Is the adverse impact of the manipulation explained by disappointment from the authorities? (slide 23) 25
Thank you! Thank you! 26
Reform in the employment Reform in the employment regime in Israel regime in Israel Took effect in the construction industry on Dec 6, 2020 The control over the permit moved from the employer to the worker Workers can use the same permit to move between employers (de- linking permit to employer) Worker who separated from employer keeps the permit for additional 60 days 27
SWB by quality of amenities provided by Israeli employers SWB by quality of amenities provided by Israeli employers Did your employer provide you sleeping arrangement?` Did your employer provide you access to shower? Did your employer provide you access to cooking facilities? According to the COVID regulations Israeli employers had to provide basic accommodation conditions to their Palestinian workers 28


")