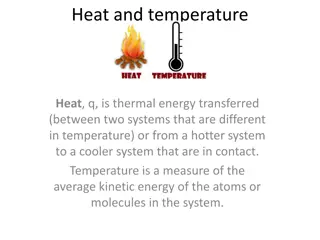
Atmospheric Thermodynamics and Humidity Measurements

Explore the key concepts of atmospheric thermodynamics including wet bulb temperature, wet bulb depression, dew-point temperature, and relative humidity. Learn how meteorologists use psychrometric charts to measure humidity and analyze air moisture content. Discover the significance of wet bulb depression in determining air humidity levels. Watch informative videos for practical exercises on finding dew-point temperature and relative humidity based on dry-bulb temperature and wet bulb depression.

Download Presentation

Please find below an Image/Link to download the presentation.
The content on the website is provided AS IS for your information and personal use only. It may not be sold, licensed, or shared on other websites without obtaining consent from the author.If you encounter any issues during the download, it is possible that the publisher has removed the file from their server.
You are allowed to download the files provided on this website for personal or commercial use, subject to the condition that they are used lawfully. All files are the property of their respective owners.
The content on the website is provided AS IS for your information and personal use only. It may not be sold, licensed, or shared on other websites without obtaining consent from the author.
E N D
Presentation Transcript
The Course of Atmospheric Thermodynamics MUSTANSIRIYAH UNIVERSITY COLLEGE OF SCIENCES ATMOSPHERIC SCIENCES DEPARTMENT 2019-2020 Dr. Sama Khalid Mohammed SECOND STAGE LECTURE 4
THIS LECTURE INCLUDING THE FOLLOWING ITEMS MOIST AIR Continue Wet Bulb Temperature Wet Bulb Depression DEW-POINT TEMPERATURE & RELATIVE HUMIDITY Thermodynamic Diagrams
Wet Bulb Temperature Tw Meteorologists commonly measure humidity by measuring the wet-bulb temperature. The wet-bulb temperature is the lowest temperature that can be achieved by evaporating water into the air parcel at constant pressure (the evaporation requires heat, which is supplied by the air parcel). It is measured using A PSYCHROMETER.
Wet Bulb Depression The difference between the air temperature (dry-bulb temperature) and the wet-bulb temperature is called WET-BULB DEPRESSION The wet-bulb depression is a relative measure of the moisture content of the air. Dry air can be cooled much further by evaporation than moist air, so a larger wet-bulb depression means less humidity (for the same dry-bulb temperature). The dew-point temperature and relative humidity are found by using psychrometric tables, with dry-bulb temperature and wet- bulb depression as the independent variables ( watch this video and do the exercise using the charts in the following slides https://www.youtube.com/watch?v=yC7EMtRCqBM
FYI: THE DEW-POINT TEMPERATURE AND RELATIVE HUMIDITY The dew-point temperature and relative humidity are found by using psychrometric tables, with dry-bulb temperature and wet-bulb depression as the independent variables ( watch this video and do the exercise using the charts in the following slides, assuming T=12 C and Tw=14 C and find the relative humidity and dew point temperture. https://www.youtube.com/watch?v=yC7EMtRCqBM
FYI: The relative humidity can be found using the dry bulb temperature and wet bulb depression
FYI: The dew point can be found using the dry bulb temperature and wet bulb depression
The relative humidity can be converted to dew point depression as follows: Recall from the previous lecture, So, A simple rule of thumb for converting RH to a dew point depression (T - Td) for moist air (RH >50%) is that Td decreases by 1 C for every 5% decrease in RH (starting at Td = dry bulb temperature (T), where RH = 100%). For example, if the RH is 85%, and the dew point depression is T - Td = 3 C.
THE DEW-POINT TEMPERATURE AND RELATIVE HUMIDITY At the Earth s surface, the pressure typically varies by only a few percent from place to place and from time to time. Therefore, the dew point is a good indicator of the moisture content of the air. In warm, humid weather the dew point is also a convenient indicator of the level of human discomfort. For example, most people begin to feel uncomfortable when the dew point rises above 20 C, and air with a dew point above about 22 C is generally regarded as extremely humid or Fortunately, dew points much above this temperature are rarely observed even in the tropics. sticky.
THE DEW-POINT TEMPERATURE AND RELATIVE HUMIDITY In contrast to the dew point, relative humidity depends as much upon the temperature of the air as upon its moisture content. On a sunny day the relative humidity may drop by as much as 50% from morning to afternoon, just because of a rise in air temperature. Neither is relative humidity a good indicator of the level of human discomfort. For example, a relative humidity of 70% may feel quite comfortable at a temperature of 20 C, but it would cause considerable discomfort to most people at a temperature of 30 C.
THE DEW-POINT TEMPERATURE AND RELATIVE HUMIDITY The highest dew points occur over warm bodies of water or vegetated surfaces from which water is evaporating. In the absence of vertical mixing, the air just above these surfaces would become saturated with water vapor, at which point the dew point would be the same as the temperature of the underlying surface. Complete saturation is rarely achieved over hot surfaces, but dew points in excess of 25 C are sometimes observed over the warmest regions of the oceans.
The Saturated Adiabatic Lapse Rate In contrast to the dry adiabatic lapse rate d, which is constant, the numerical value of the saturated adiabatic lapse rate s varies with pressure and temperature. Because water vapor condenses when a saturated air parcel rises, it follows that s < d. Actual values of s range from about 4 K/km near the ground in warm, humid air masses to typical values of 6-7 K/km in the middle troposphere.
Stability of Saturated Air The parcels will be stable when < s, Neutral = s ,Unstable > s
Thermodynamic Diagrams we can look at the following equation of potential temperature graphically, then we will get e.g., the Pseudo-adiabatic chart . 0 286 . 0 0 286 p p 0 p = = . 0 286 T p T Re-arrange: So if you plot: p0.286 on y-axis, T on x-axis For a constant , (p00.286/ ) is also a constant, so the graph yields a straight line with gradient given by (p00.286/ ), and passing through T=0 and p=0
Pseudo-adiabatic chart Earth s atmosphere y-axis is linear for p0.286 also linear for ln(p)
Pseudo-adiabatic chart isotherms are vertical and dry adiabats (constant ) are oriented at an acute angle relative to isotherms. Because changes in temperature with height in the atmosphere generally lie between isothermal and dry adiabatic, most temperature soundings lie within a narrow range of angles when plotted on a pseudo-adiabatic chart. Advantage: we can follow each line and determine graphically temperature at any pressure, assuming adiabatic expansion / compression. Disadvantage: Everything happens in small region of the chart.
Skew T ln P chart This restriction is overcome in the so-called skew T -ln p chart, in which the ordinate (y) is ln p and the abscissa (x) is x=T+(constant)y = T-(constant)ln p So y=(x T)/(constant) and for an isotherm T is constant, the relationship between y and x for an isotherm is of the form y = mx + c, where m is the same for all isotherms and c is a different constant for each isotherm. Therefore, on the skew T - ln p chart, isotherms are straight parallel lines that slope upward from left to right.
Skew T ln P chart The scale for the x axis is generally chosen to make the angle between the isotherms and the isobars about 45 , as depicted schematically in Fig. Note that the isotherms on a skew T - ln p chart are intentionally skewed by about 45 from their vertical orientation in the pseudoadiabatic chart (hence the name skew T ln p chart).
Skew T ln P chart From (eq 1), the equation for a dry adiabat ( constant) is ln P = (constant) ln T + constant Hence, on a ln p versus ln T chart, dry adiabats would be straight lines. Since ln p is the ordinate on the skew T ln p chart, but the abscissa is not ln T, dry adiabats on this chart are slightly curved lines that run from the lower right to the upper left. The angle between the isotherms and the dry adiabats on a skew T ln p chart is approximately 90 . Therefore, when atmospheric soundings are plotted on this chart, small differences in slope are more apparent than they are on the pseudoadiabatic chart. temperature
What are all the lines on the skew T-ln p chart? isobar isotherm dry adiabat saturated adiabat saturation mixing ratio