Hydrographs: Descriptions and Explanations
Learn about hydrographs, describing and explaining their data, and how human activities can impact the hydrological cycle. Practice analyzing hydrographs, identifying peak rainfall, discharge levels, lag time, urban vs. rural influences, and more. Enhance your knowledge of the hydrosphere with practical examples and tasks.

Download Presentation

Please find below an Image/Link to download the presentation.
The content on the website is provided AS IS for your information and personal use only. It may not be sold, licensed, or shared on other websites without obtaining consent from the author.If you encounter any issues during the download, it is possible that the publisher has removed the file from their server.
You are allowed to download the files provided on this website for personal or commercial use, subject to the condition that they are used lawfully. All files are the property of their respective owners.
The content on the website is provided AS IS for your information and personal use only. It may not be sold, licensed, or shared on other websites without obtaining consent from the author.
E N D
Presentation Transcript
Lesson six: Explaining (and describing) hydrographs Learning intentions: We are learning about the hydrosphere. Success criteria: I can describe a hydrograph, referring to data from the hydrograph. I can explain a hydrograph.
Homework reminder Booklet page 1. 1. Explain the global hydrological cycle. You may wish to draw an annotated diagram. (6) 2. Suggest how human activities such as those written below can impact on the hydrological cycle. (6) Deforestation, building, Reservoirs, Urbanisation and Mining. 3. Account for the differences between the urban and rural hydrographs shown in the diagram following a heavy rainstorm. (5) Irrigation, Dam
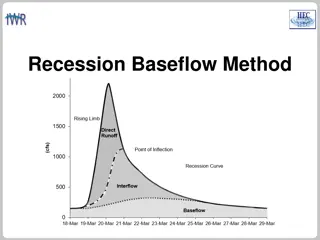
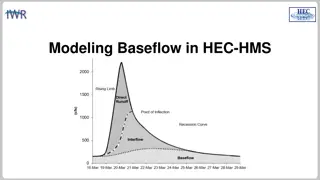
What you need to know You should be able to explain a hydrograph. This involves describing it by reading data from the graph, explanations for the data. You must both describe and explain to get full marks, even though the question will only ask you to explain. Let s practice describing first. and then providing
Starter Look at the hydrograph on page 13 of your booklets. Write down: The time and date when it started raining. The time and date of peak rainfall, and its measurement in millimeters. The time and date when it stopped raining. The time and date of when the discharge started to rise, and how many cumecs/m it measured. The lag time. The time and date of when the discharge returned to normal.
It started raining at 5am on the 26th of July. Peak rainfall was at 8am on the 26th at 6.25mm. By 6pm it had stopped raining on the 26th. Discharge started to rise at 3am where they gradually increased until 10am where they reached 0.5m. After a small dip it rose again until peak discharge of 0.7m at 6pm. Lag time is 10 hours. From 6pm onwards the river levels continue to drop until they reach 0.5 at midnight.
Structure 1. Work out lag time with a ruler (time and mm of peak rainfall, and time and mm of peak discharge). 2. Describe the discharge line graph. 3. Work out if it is urban or rural. 1. Urban enters river quickly from overland flow, gutters and drains. 2. Rural infiltration, percolation, throughflow, and absorption, transpiration. Other things to consider shape of land (hilly or flar), type of rock, and size of drainage basin.
Describing As you have just done, when describing, you should mention: The time and date when it started raining. The time and date of peak rainfall, and its measurement in millimeters. The time and date when it stopped raining. The time and date of when the discharge started to rise, and how many cumecs it measured. The lag time. The time and date of when the discharge returned to normal.
Explaining You must then provide reasons which take into consideration surfaces (man made i.e. impermeable concrete/drains, or natural i.e soil), vegetation and size of the drainage basin. You should also be able to state whether it is likely to be a rural or urban hydrograph, explaining how you know this. E.g. The lag time is 10 hours. The longer lag time may be due to flat or gently sloping land meaning it takes longer for the rainfall to reach the river. There may also be a lot of soil cover and vegetation in the area, which infiltrates and intercepts the rainfall into the soil, making it take much longer to reach the river channel. It might be quite a large drainage basin, which will take longer for the rainfall to reach the river.
Task 6 Explain the changing river levels on the River Nene in Northampton from 29th to 30th April 2012. (8)
How to structure The time and date when it started raining. The time and date of peak rainfall, and its measurement in millimeters. The time and date when it stopped raining. The time and date of when the discharge started to rise, and how many cumecs it measured.EXPLAIN The lag time. EXPLAIN The time and date of when the discharge returned to normal. EXPLAIN
Perfect answer The rain started at 2am on 29th April 2012. The peak rainfall was at 6am and measured 3.8mm. It stopped raining at 4pm on 29th April 2012. The peak discharge was at 10am and was 73 cumecs. This means the lag time was 4 hours. The short lag time indicates that the hydrograph is for an urban area.
Perfect answer Some rain will infiltrate the soil. However, due to drains and impermeable surfaces, most water is directed straight back into the river. As the rainfall gets heavier, underground stores become full. The soil becomes saturated causing water to runoff the land and enter the river quicker. This could cause flooding to occur.
Perfect answer Between 18.00 and 48.00 hours there is no rainfall. This causes the river level to decrease gradually to 42cms. From the graph you can see the falling limb is much more gentle than the rising limb. This is because water is being added into the river from throughflow almost as quickly as the river is draining it away.
Other explanations 1mark for each River basin may be small allowing rainfall to reach river quickly. Drainage basin may be steep sided so water more likely to reach river quickly. Underground stores will eventually become saturated causing water to enter river quickly. Human activities such as deforestation will reduce affect of vegetation such as interception/absorption increasing runoff. A high number of tributaries may lead to short lag time as runoff /channel flow is increased. Rock type may be permeable allowing water to flow through and reach river more slowly.
Success criteria I can describe a hydrograph, referring to data from the hydrograph. I can explain a hydrograph.
Plenary Ask the teacher. Ask the teacher anything to do with the Hydrosphere topic.
")