Homelessness in Orange County
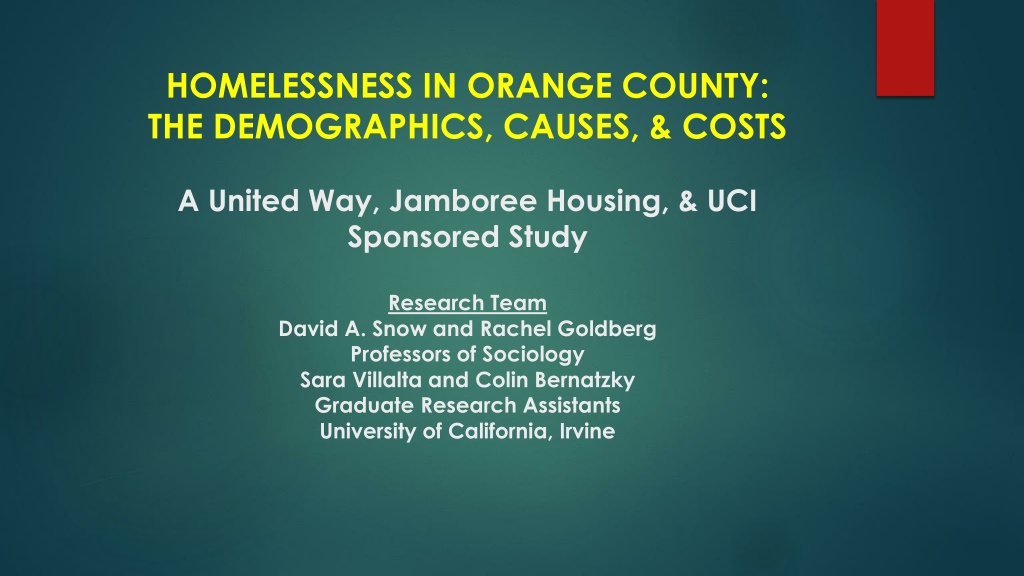
A study conducted by United Way, Jamboree Housing, and UCI sheds light on the demographics, causes, and costs of homelessness in Orange County. Led by Professors David A. Snow and Rachel Goldberg, along with graduate research assistants Sara Villalta and Colin Bernatzky, the research delves into the complex issues surrounding homelessness in the area.
Download Presentation

Please find below an Image/Link to download the presentation.
The content on the website is provided AS IS for your information and personal use only. It may not be sold, licensed, or shared on other websites without obtaining consent from the author.If you encounter any issues during the download, it is possible that the publisher has removed the file from their server.
You are allowed to download the files provided on this website for personal or commercial use, subject to the condition that they are used lawfully. All files are the property of their respective owners.
The content on the website is provided AS IS for your information and personal use only. It may not be sold, licensed, or shared on other websites without obtaining consent from the author.
E N D
Presentation Transcript
HOMELESSNESS IN ORANGE COUNTY: THE DEMOGRAPHICS, CAUSES, & COSTS A United Way, Jamboree Housing, & UCI Sponsored Study Research Team David A. Snow and Rachel Goldberg Professors of Sociology Sara Villalta and Colin Bernatzky Graduate Research Assistants University of California, Irvine
OBJECTIVES Primary Objective: To estimate the costs of homelessness in Orange County with a focus on the cost differences between the street and sheltered homeless and those now housed in the different categories of housing -- in Interim/Bridge housing, Rapid Rehousing, and Permanent Supportive Housing Secondary Objective: To construct a profile of the demographic and biographic correlates associated with the different categories of homelessness and housing,
WHO COUNTS AS A HOMELESS PERSON? HUD Definition of Homelessness PEOPLE Living/sleeping in public or privates places not intended for human habitation e.g., sidewalks, building alcoves, alleys, under bridges, abandoned buildings, parks, weed patches (often called sleeping rough ) Sleeping in shelters Living/sleeping in vehicles e.g., cars, vans, campers Evicted from their homes, discharged from an institution like a hospital or a prison, or are fleeing domestic or sexual violence and can t find housing. Spending a few nights in a seedy motel or hotel with no place else to go Doubling-up e.g., living with others Living in temporary transitional or supportive housing after being on the streets Living in unserviced, makeshift, substandard housing e.g., favelas in Brazil Living in refugee and disaster emergency camps Our Definition of Homelessness Living itinerant groups e.g., nomads, gypsies, refugees Living on squats or squatting communities
KEY TERMS TO KEEP IN MIND Emergency Shelter: a location to sleep overnight, often on a first come, first served basis. Bridge Housing: temporary residence, ranging from 6 to 24 months. It typically includes supportive services to help residents secure some stability and enhance their employability. Also known as interim or transitional housing. Rapid Re-Housing: moves people quickly out of homelessness and into their own housing, while providing temporary time-limited assistance that covers move-in costs, deposits, and rental and/or utility assistance, along with case management. Permanent Supportive Housing: a program designed to provide housing and supportive services on a long-term basis to formerly chronic homeless people. Chronic Homelessness: A homeless individual/head of household with one or more disabilities Must have been homeless for at least 12 months or on at least 4 separate occasions in the last 3 years
COST STUDY DESIGN Street Homeless Municipalities Shelters Interview- Based Biographic and Service Utilization Data Hospitals with ERs Institutional- Organizational Cost Data Transitional/ Interim Costs Non- Governmental Agencies Rapid County PSH
INTERVIEW SETTINGS FOR HOUSING CONFIGURATIONS Site/Location of Interview Completed (unduplicated) 48 15 15 13 4 1 41 10 8 6 6 5 5 1 25 14 5 4 2 49 24 22 3 SHELTER Friendship Shelter Armory The Courtyard Salvation Army Build Futures TRANSITIONAL/INTERIM WISE Place Build Futures Family Assistance Ministries Families Forward Salvation Army Colette's Children s Home Pathways of Hope RAPID RE-HOUSING Families Forward SPIN Mercy House Family Assistance Ministries PERMANENT SUPPORTIVE Jamboree Mercy House Colette's Children's Home
DEMOGRAPHIC & BIOGRAPHIC CHARACTERISITCS OF ORANGE COUNTY S HOMELESS POPULATION
SOCIO-DEMOGRAPHIC COMPARISONS AMONG INTERVIEW SAMPLE ACROSS HOUSING CATEGORIES Variables Street Shelter Trans/ Interim Rapid Re- Housing Permanent Supportive Total 73% 27% 48 65% 35% 52 37% 63% 43 28% 72% 42 53% 47% 53 57% 43% 50 % Male* % Female* Median Age* Race/Ethnicity* 28% 23% 46% 36% 22% 30% % Hispanic 52% 40% 34% 28% 65% 47% % Non-Hispanic White 10% 25% 12% 28% 8% 15% % Non-Hispanic Black 3% 7% 10% 16% 9% 2% 8% 13% 0% 2% 17% 5% 4% 4% 16% 8% 2% 2% 4% 10% 4% 4% 10% 12% % Asian % Native American % Foreign-born % Veteran % With any schooling beyond high school 42% 52% 51% 40% 45% 46% 89 48 41 25 49 252 Number interviewed * Differences between housing categories are statistically significant at p<0.05 level
LENGTH OF TIME IN ORANGE COUNTY, BY HOUSING STATUS 100% 90% 80% 52% 56% 70% 65% 68% 73% 60% 80% Percent 50% 5% 12% 40% 15% 6% 30% 7% 6% 24% 5% 15% 20% 13% 9% 10% 10% 4% 8% 20% 5% 12% 10% 8% 7% 6% 0% Street Shelter Trans/Int RR PSH Total 0-6 months 7-12 months 1-5 yrs 6-10 yrs > 10 yrs
SOCIO-DEMOGRAPHIC COMPARISONS AMONG INTERVIEW SAMPLE ACROSS HOUSING CATEGORIES Variables Street Shelter Trans/ Interim Housing Rapid Re- Housing Permanent Supportive Housing Total 34% 42% -- -- -- -- % Chronically homeless* % Homeless 3 yrs in most recent spell* 37% 46% 18% 11% 88% 42% 66% 52% 56% 44% 47% % Homeless 2+ times over lifetime 56% 71% 85% 60% 8% 80% % Live alone* 67% 2% 2% 12% 12% 10% 6% % Married 1% 0% 34% 84% 12% 17% % Live with children under 18* 0 0 0.7 1.8 0.2 0.3 Average # children < 18* 53% 40% 37% 28% 55% % Reporting fair/poor health 45% % Reporting feeling depressed most or all of the time in the last 30 days* 22% 19% 5% 8% 27% 18% Number interviewed * Differences between housing categories are statistically significant at p<0.05 level 89 48 41 25 49 252
CAUSES OF HOMELESSNESS IN ORANGE COUNTY
HOMELESSNESS & MUSICAL CHAIRS In thinking about the causes of homelessness, think about the game of musical chairs, with the chairs connoting housing and the people left standing as the homeless. Then ask two questions? (1) What causes the chairs (housing) to be removed or in short supply? (2) What causes some people (the homeless) rather than others to be left standing?
In an evidence-based world, the answer to these two questions resides in the intersection between two sets of factors: (1) the structural antecedents of limited or inaccessible housing (the metaphoric chairs) (2) personal, biographic deficits which accentuate vulnerability to being left standing (the homeless)
INFLATION-ADJUSTED MEDIAN RENT INCREASED 24% WHILE MEDIAN RENTER INCOME DECLINED 10% FROM 2000 TO 2014
ORANGE COUNTY IS AMONG THE TOP 10 LEAST AFFORDABLE METROPOLITAN AREAS IN THE NATION! 2017 Facts for 2-Bedroom FMR in Orange County Fair Market Rent (FMR) $1,813 Annual income needed $72,520 Housing wage $34.87 Full time jobs needed at minimum wage 3.3 Work hours per week needed at minimum wage 133 Percent of renters unable to afford FMR 60% Rent affordable to SSI recipient $267 Source: Out of Reach, National Low Income Housing Coalition, 2016.
EMPLOYMENT AND EARNINGS BY HOUSING CATEGORY Variables Street Shelter Trans/ Interim Rapid Re- Housing Permanent Supportive Housing Total % Worked in last 30 days* 15% 17% 49% 76% 16% 27% Median job earnings in last 30 days (includes not employed)* $0 $0 $420 $1,114 $0 $0 Median earnings from other sources in last 30 days Median total earnings from job AND other sources in last 30 days* $410 $304 $800 $490 $892 $544 $500 $520 $1,500 $1,958 $898 $860 Number interviewed 89 48 41 25 49 252 * Differences between housing categories are statistically significant at p<0.05 level
So, given these observations regarding the structural antecedents of homelessness in Orange, County, how do the homeless account for their homelessness? STRUCTURAL ANTECEDENTS Securing or retaining jobs with sustainable wages: 40% Finding or retaining affordable housing: 36% BIOGRAPHIC DEFICITS/VULNERABILITIES. Family issues (e.g., sexual violence, abuse, death): 28% Drugs/alcohol: 22% Mental Illness: 17% Physical Health: 13% Released from Prison/Jail: 7%
SELECTED CHILDHOOD CONDITIONS, ACROSS HOUSING CATEGORIES Variables Street Shelter Trans/ Interim Rapid Re- Housing Permanent Supportive Total % Experienced sexual and/or physical abuse as a child % had parent or other adult household member with alcohol or drug problem when growing up % with parent or immediate family member who spent at least one night homeless when growing up % spent time living with non-parental relatives responsible for their care, with foster parents, or in orphanage in childhood % spent time in juvenile correction facility when growing up 27% 35% 39% 36% 29% 32% 47% 37% 41% 40% 39% 42% 18% 8% 12% 8% 16% 14% 18% 10% 24% 20% 19% 18% 8% 4% 2% 8% 8% 6% Number interviewed 89 48 41 25 49 252 * Differences between housing categories are statistically significant at p<0.05 level
Reasons For Homelessness: Women (Results from latent class cluster analysis 3 cluster solution) PERCENT OF HOMELESS WOMEN PREDICTED TO BE IN EACH CLUSTER Probabilities of each reason, for Cluster 2 Cluster 3: Drugs/alcohol 5% Mental health Probabilities of each reason, for Cluster 1 Physical health Cluster 2: Domestic violence 21% Release from jail/prison Other family issues Mental health Death in family Physical health Domestic violence Alcohol Release from jail/prison Drugs Lack of affordable housing Other family issues Insufficient wages Death in family Job loss Domestic violence 0 10 20 30 40 50 60 70 80 90 100 Alcohol Drugs Probabilities of each reason, for Cluster 3 Lack of affordable housing Insufficient wages Mental health Job loss Physical health Release from jail/prison 0 10 20 30 40 50 60 Other family issues Death in family Domestic violence Alcohol Cluster 1: Lack of affordable housing/job loss 74% Drugs Lack of affordable housing Insufficient wages Job loss 0 10 20 30 40 50 60 70 80 90 100
Reasons For Homelessness: Men (Results from latent class cluster analysis 3 cluster solution) PERCENT OF HOMELESS MEN PREDICTED TO BE IN EACH CLUSTER Cluster 3: Probabilities of each reason, for Cluster 3 Reentry/drugs/mental health 21% Probabilities of each reason, for Cluster 1 Mental health Physical health Release from jail/prison Mental health Other family issues Death in family Physical health Domestic violence Release from jail/prison Alcohol Drugs Other family issues Lack of affordable housing Insufficient wages Death in family Job loss Domestic violence 0 10 20 30 40 50 60 70 80 90 100 Alcohol Drugs Probabilities of each reason, for Cluster 2 Lack of affordable housing Mental health Insufficient wages Physical health Job loss Release from jail/prison Other family issues 0 10 20 30 40 50 60 70 Death in family Cluster 2: Family issues/drugs/health 22% Domestic violence Cluster 1: Lack of affordable housing/job loss 57% Alcohol Drugs Lack of affordable housing Insufficient wages Job loss 0 10 20 30 40 50 60 70 80 90 100
ESTIMATED COSTS OF HOMELESSNESS IN OC 2015
COST TOTAL ACROSS INSTITUTIONAL SECTORS Cost Categories Accumulating Costs Based on Data Collected Accumulating Costs Based on Data Collected Plus Imputations County $62,167,417 $62,167,417 (no imputation) Municipalities $115,158,683 (21 reporting) $120,338,343 (imputation: 1% of FY2014/2015 Total Expenses) Non-Governmental Housing Agencies $21,531,320 (20 reporting) $34,563,038 (imputation: median budget spent on homeless by 20 reporting) $5,638,823 (no imputation) Other Non-Governmental Agencies Servicing the Homeless Hospitals & Emergency Depts. TOTAL $5,638,823 (9 reporting) $76,565,034 $76,565,034 (no imputation) $299,272,655 $281,061,277
ANNUAL COST OF ADDRESSING HOMELESSNESS ACROSS FOUR INSTITUTIONAL SECTORS IN OC $140,000,000 $120,338,343 $120,000,000 $100,000,000 $76,565,034 $80,000,000 Dollars $62,167,417 $60,000,000 $34,563,038 $40,000,000 $20,000,000 $0 Municipalities (21 reporting + 13 imputed) Hospitals County Housing agencies (20 reporting plus 21 imputed) Notes: Housing agencies are agencies providing overnight shelter, transitional/interim/bridge housing, rapid rehousing, or permanent supportive housing services, and the figure provided totals the program budget spent on homelessness across these agencies.
Annual Cost of Addressing Homelessness Across Three Cost Clusters in OC $140,000,000 $120,582,177 $120,000,000 $105,932,061 $100,000,000 $80,000,000 Dollars $60,000,000 $40,000,000 $23,771,292 $20,000,000 $0 Health Care Cluster Housing Cluster Law Enforcement Cluster
FIGURE 5 MEAN COST PER PERSON FOR SERVICE UTILIZATION IN LAST YEAR, BY HOUSING CONFIGURATION $120,000 $100,759 $100,000 $80,000 Dollars $58,560 $60,000 $51,587 $44,923 $42,010 $40,000 $25,816 $22,686 $20,000 $9,175 $0 Notes: Cost estimates consider utilization of soup kitchens, food pantries, substance abuse services, ambulance services, ER services, inpatient hospital stays, mental health services, other health services, motel/voucher/rental assistance services, shelter nights, transitional housing nights, rapid rehousing nights, PSH nights, policing, nights in jail/prison. These estimates do not capture other potential costs, including probation, changes in property values, park maintenance costs, etc. Reports from the last month are annualized.
MEAN COST PER PERSON FOR SERVICE UTILIZATION IN LAST YEAR, COMPARING PSH CLIENTS TO THE CHRONICALLY HOMELESS $120,000 $100,759 $100,000 $85,631 $80,000 Dollars $58,560 $60,000 $51,587 $40,000 $20,000 $0 Chronic street Chronic shelter Total chronic (street & shelter) PSH Notes: Cost estimates consider utilization of soup kitchens, food pantries, substance abuse services, ambulance services, ER services, inpatient hospital stays, mental health services, other health services, motel/voucher/rental assistance services, shelter nights, transitional housing nights, rapid rehousing nights, PSH nights, policing, nights in jail/prison. These estimates do not capture other potential costs, including probation, changes in property values, park maintenance costs, etc. Reports from the last month are annualized.
COST SAVINGS THROUGH PERMANENT SUPPORTIVE HOUSING Costs for services for those who are chronically homeless are 50% lower per person per year when people are housed ($51,587 including housing costs) vs living on the streets ($100,759) Chronic homeless when housed have: 78% fewer ambulance rides and 100% fewer arrests
NUMBER OF CHRONIC PHYSICAL HEALTH CONDITIONS REPORTED BY STREET/SHELTER HOMELESS, BY LENGTH OF TIME ON THE STREET 100% 15% 23% 33% 90% 35% 80% 44% 70% 38% 60% Percent 50% 50% 40% 30% 33% 29% 20% 10% 0% 0-12 months 1-2 years 3+ years 0 conditions 1-2 conditions 3 or more conditions Note: Chronic physical health conditions include arthritis, asthma, cancer, cardiovascular disease, chronic bronchitis, chronic obstructive lung disease, cirrhosis or severe liver damage, diabetes, emphysema, epilepsy or other seizure disorder, HIV/AIDS, hypertension, leukemia, and lymphoma
PER CAPITA ANNUAL COST OF SERVICES BY HOUSING CONFIGURATION, ACROSS THE DISTRIBUTION 25% 50% 75% 90% $439,787 $433,845 $55,334 Street (chronic) Shelter (chronic) Permanent supportive housing Shelter (non- chronic) Street (non-chronic) Transitional Rapid rehousing $3,010 $1,695 $9,914 $11,372 $8,081 $11,094 $21,720 $33,740 $16,844 $3,897 $7,880 $14,459 $28,384 $1,180 $6,158 $3,394 $4,870 $10,166 $5,161 $14,640 $16,768 $12,477 $27,680 $24,827 $18,233
MOST COSTLY 10% OF CHRONIC HOMELESS Housed with Services On the Streets $439,787 per person per year $55,343 per person per year
DIFFERENCES IN PATTERNS OF BEHAVIOR AND WELLBEING ACROSS HOUSING CATEGORIES Variables Street Shelter Housed Total Trans/Int 0.11 0.02 0.02 RR 0.05 0 0 PSH 0.08 0 0.06 # times ticketed* # times arrested* # times in ambulance % had trouble getting things done because of alcohol or drugs in last month* % Find it difficult or very difficult to find safe place to sleep % Find it difficult or very difficult to find place to wash/shower % Find it difficult or very difficult to get clean clothes % Find it difficult or very difficult to find toilet % Find it difficult or very difficult to feel good about self Total number interviewed 0.68 0.15 0.20 0.10 0.02 0.15 0.30 0.06 0.11 22% 13% 0 0 10% 12% 49% 29% 5% 4% 2% 25% 56% 13% 12% 0 0 24% 40% 47% 43% 89 15% 19% 33% 48 2% 0 12% 41 0 12% 4% 18% 49 20% 21% 28% 251 4% 12% 24 * Differences between housing categories are statistically significant at p<0.05 level
THREE MAJOR TAKE-AWAYS and a QUESTION 1.The primary cause of homelessness is the gap between the cost of rental housing and the availability of living wages to access that housing. 2. The cost of homelessness decreases markedly with the provision of housing, and this cost reduction is most pronounced for the chronic homeless. 3. Many of the troublesome issues associated with homelessness disappear or diminish markedly with the provision of housing. SO WHY THE ONGOING NIMBY RESPONSE TO HOUSING FOR THE HOMELESS ????
ORANGE COUNTYS MILLION DOLLLAR MURRAYS
PRELIMINARY RECOMMENDATIONS Develop specific numeric goals for the creation of the different kinds of housing solutions i.e. identify how many units of Permanent Supportive Housing, Rapid Re-Housing and how many beds for Bridge and Emergency shelter are needed. Prioritize populations to be housed first, beginning with the top 10% of the chronically homeless. If this group remains on the streets their costs are likely to be at least $439,787 per person per year. By contrast, the top 10% of those housed with services incur annual costs of only $55,332 per person. Assess and map current public and private funding and resources dedicated or available to address homelessness and create public-private partnerships to bridge gaps and redeploy existing resources.
INTERVIEW SETTINGS/CONTEXTS Site/Location of Interview Street Civic Center S.A. River Bed Camp SOS Lions Park Hart Park Pioneer Park FAM NB Transit Center Build Futures Friendship Shelter Courtyard Housing Types Shelter Transitional/Interim Rapid Rehousing PSH TOTALS Completed 89 26 13 12 10 9 5 5 5 1 2 1 163 48 41 25 49 252
TABLE 4A COUNTY COSTS County Department/Division Accumulating Costs Orange County (per Director of Care Coordination & County) Orange County Transit Authority $60,093,851 $2,073,566 TOTAL 62,167,417
TABLE 4B1 MUNCIPALITIES SUBMITTING QUESTIONNAIRES Aliso Viejo Anaheim Buena Park Costa Mesa Dana Point Fountain Valley Fullerton Garden Grove Huntington Beach Irvine Mission Viejo Laguna Beach Newport Beach Orange Placentia San Clemente Santa Ana Stanton Tustin Villa Park Westminster Yorba Linda
Sampling and Fielding of Agency Surveys Assembled list of 246 non-governmental agencies that service the homeless (Based on list provided by 2-1-1 of approx. 600 agencies, as well as other searches) Assigned each agency to 1 of 12 strata based on services provided (12 strata: health services, ambulance provider, soup kitchen, food pantry, hygiene and/or clothing, referral, multi-purpose non-housing, motel/housing vouchers and/or rental assistance, shelter, transitional/interim, rapid re-housing, permanent supportive housing) Randomly selected 11 agencies per stratum to yield sample of 116 agencies representing diverse range of services (Strata with 11 or fewer agencies were sampled at 100%) Sent questionnaires to sampled agencies (July 2016)
TABLE 4C1 AGENCY STRATA AND SAMPLE Population of agencies 88 29 22 16 15 13 11 10 9 # agencies sampled Stratum Food pantry Soup kitchen Hygiene and/or clothing Health services Transitional/interim housing Referral Private ambulance provider Permanent supportive housing Rapid rehousing Motel/housing vouchers and/or rental assistance Multipurpose non-housing Shelter/emergency shelter Total 11 11 10 8 11 11 11 10 9 8 8 8 7 8 7 246 116
TABLE 4C2 SURVEY OF NON-GOVERNMENTAL AGENCIES RESPONDED AltaMed Health Services Build Futures RESPONDED Mental Health Association of OC Mercy House Living Centers Mission Committee of the First Presbyterian Church of Orange Off the Streets Huntington Beach One Step Ministry Orange County Rescue Mission Project HOPE Alliance Saint Mary s by the Sea Catholic Church Saint Mary s Fullerton Salvation Army Serving People In Need, Inc. Share Our Selves Stand Up for Kids 2-1-1 South County Outreach WISE Place CARE Ambulance Service City Net Colette s Children s Home Costa Mesa Family Resource Center Families Forward Family Assistance Ministries Family Promise of Orange County, Inc. Friendship Shelter, Inc. Grandma's House of Hope H.O.P.E. (Helping Other People Everyday) Illumination Foundation Jamboree Housing Corporation Laurel House Living Waters Christian Fellowship
TABLE 4B2 COST FINDINGS FROM MUNICIPALITIES (FY 2014/2015) Statistic # municipalities reporting statistic $113,645,808 21 Median total municipal budget FY 2014/2015 Median % of municipal budget spent on homelessness Median municipal budget spent on homelessness Total amount spent on homelessness across 21 municipalities 1% 21 $1,760,510 21 21 $115,158,683 Note: Uses Total Expenses for FY2014/2015. Municipalities reporting a percent of the municipal budget spent on homelessness of under 1% are rounded up to 1%, as are those that did not provide a percentage.
4C3 COSTS FINDINGS FOR NON-GOVERNMENTAL AGENCIES (2015) Statistic # agencies reporting statistic $822,126 31 Median total program expenses 2015 773 72.5% 77.0% 30 30 31 Median # clients served 2015 Median % of service encounters with homeless Median % of agency budget spent on homelessness Median amount of agency budget spent on homelessness Total spent on homelessness across 29 agencies $27,170,143 $399,007 29
TABLE 4D COST FINDINGS ON OC HOSPITAL ER & INPATIENT (CHARGES) AGENCY/ HOSPITAL Cal Optima via Hospital Assoc. of SC OSPHD files via OC Health Care Agency Total EMERGENCY DEPT/ROOM 6480 X $900 X 3.3 = $19,245,600 INPATIENT TOTALS $19,245,600 1609 X $35,624.28 = $57,319,434 $57,319,434 $76,565,034 Note: Only one major OC hospital provided detailed cost data. The above are aggregated figures across all OC hospitals and emergency rooms.
TABLE 5A HEALTH CARE CLUSTER Data Source County data Estimated Cost $25,474,611 Orange County Health Care Agency Emergency Departments Hospital Inpatient Ambulance Services Cal Optima data OSPHD data CARE Ambulance data and OC HCA data on # of vehicles possessed by OC ambulance companies in 2015 Service utilization data from our homeless interviews and program cost per visit data from our agency questionnaire $19,245,600 $57,319,434 $2,486,982 Other Physical and Mental Health Services $16,055,550 Total $120,582,177
TABLE 5B HOUSING CLUSTER Estimated Cost $32,530,693 County (funding for Continuum of Care, dedicated shelters, veterans affairs supportive housing, housing choice vouchers) Non-governmental housing agencies Municipalities (8 reporting housing initiatives) Total $34,563,038 $58,841,342 $105,932,061
TABLE 5C LAW ENFORCEMENT CLUSTER Data Source County data Estimated Cost $780,000 Sheriff s Department (Homeless Liaison Officers) Police Departments (Reports by 17 Municipalities, and Imputation to 1% of Dept Budget for Other 17 Municipalities) Jail/prison Municipality questionnaires and online budget data $17,468,183 Homeless interview data and jail bed cost provided by Sheriff s Department $5,523,109 Total Notes: Municipalities reporting a percentage of the police department budget spent on homelessness of under 1% are rounded up to 1%, as are those that did not provide a percentage. These figures do not provide estimates for probation. $23,771,292
Definition of Chronically Homeless HUD definition Definition we are using Homeless individual with a disability who lives in a place not meant for human habitation, a safe haven, or in an emergency shelter, or has lived in an institutional care facility (jail, hospital, substance abuse or mental health treatment facility) for < 90 days and met the previous criteria before entering the facility Resides on the street or in an emergency shelter Reports being homeless for 12 months in current spell Reports a disability: Trouble getting things done over last 30 days b/c of alcohol or drugs Has been residing in such a place continuously for 12 months or on 4 separate occasions in last 3 yrs (combined occasions total 12 months; each period separating occasions is 7 nights) Difficulty getting from one place to another, working, or just getting through the day because of a serious mental illness, PTSD, brain injury or developmental disability, chronic physical illness, or disability Disability: Head of household has a diagnosable substance use disorder, serious mental illness, developmental disability, PTSD, cognitive impairments resulting from a brain injury, or chronic physical illness or disability Source: Defining Chronically Homeless Final Rule (HUD, 2015)
FIGURE 6A2 ABUSED BY MEMBER OF HOUSEHOLD DURING CHILDHOOD, BY RESPONDENT SEX 25 19.63 19.44 20 17.93 15.89 15 11.55 10 5.56 4.67 5 2.39 0.69 0 Phys abuse only Sexual abuse only Phys and sexual abuse Male Female Total
TABLE 6D1 AVERAGE (MEAN) SERVICE UTILIZATION IN PAST MONTH, BY HOUSING CATEGORY Variables Street Shelter Housed RR Total Trans/Int PSH # times accessed soup kitchen or food pantry* # times accessed substance abuse services* 16.96 1.14 22.90 0.79 2.12 3.46 2.88 1.25 2.22 0.67 11.45 1.37 # times in ER # times in ambulance # times inpatient in hospital # times accessed mental health services # times accessed other health services* # nights in shelter or emergency shelter* Total number interviewed 0.37 0.20 0.13 1.18 0.63 0.24 0.42 0.15 0.06 0.54 0.52 18.48 0.20 0.02 0.02 1.61 0.85 2.15 0.29 0 0 0.83 0.71 0 0.33 0.06 0.08 1.31 1.78 0 0.33 0.11 0.08 1.12 0.88 3.97 89 48 41 24 49 251 Note: Other health services encompass any physical health services not detailed above (e.g., annual physicals, physician office visits, etc.)
