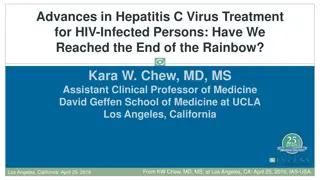
High Frequency of Unintended Pregnancy and Contraceptive Choice Among HIV-infected African Women
Reproductive health burden in sub-Saharan Africa is significant, with high rates of unintended pregnancies among HIV-infected women. The study aims to identify predictors of contraceptive choice and address the gap in effective family planning methods to reduce unintended pregnancies. Variations in contraceptive use and reported reasons for not using effective family planning methods are highlighted, emphasizing the need for targeted interventions to improve access and utilization of long-acting reversible contraceptive methods.
Download Presentation

Please find below an Image/Link to download the presentation.
The content on the website is provided AS IS for your information and personal use only. It may not be sold, licensed, or shared on other websites without obtaining consent from the author.If you encounter any issues during the download, it is possible that the publisher has removed the file from their server.
You are allowed to download the files provided on this website for personal or commercial use, subject to the condition that they are used lawfully. All files are the property of their respective owners.
The content on the website is provided AS IS for your information and personal use only. It may not be sold, licensed, or shared on other websites without obtaining consent from the author.
E N D
Presentation Transcript
PEPFAR PROMOTE STUDY High Frequency of Unintended Pregnancy and Predictors of Contraceptive Choice among HIV-infected African Women on Lifelong ART J. Aizire , N. Yende , T. Nematadzira , M.E. Nyati , S. Dadabhai , L. Chinula , C. Nakaye , M. Naidoo , M.G. Fowler , T. Taha , US-PEPFAR PROMOTE Cohort Jim K. Aizire, MD, MHS, PhD Johns Hopkins University 26 July 2018
Background Reproductive health burden in sub-Saharan Africa Home to more than 90% of the reproductive health needs globally Women of reproductive age constitute more than 60% of the HIV/AIDS burden Several countries have more than 60% unmet need for modern family planning methods More than 85% of unintended pregnancies are attributed to non-use of an effective family planning (EFP) method (injectable, oral, intra-uterine contraceptive device (IUCD), or Norplant). Most commonly reported reasons for not using EFP include infrequent sex and safety/side-effects. Others include postpartum/breastfeeding, opposition by the partner, as well as access related reasons. Department of Economic and Social Affairs PDUN. Trends in contraceptive use worldwide 2015. Contraception. 2015: Darroch JE et al, Lancet 2013; Darroch JE et al, Responding to Women s Needs. New York: Guttmacher Institute; 2011 26 July 2018 2
Study design HIV infected women on ART JUN 2017 DEC 2016 SEP 2015 PROMISE RCT PEPFAR PROMOTE STUDY GAP 2020 2015 2016 2017 2018 2019 2020 2021 2011 Baseline assessments Follow-up assessments Socio-demographic data Clinical data (reproductive health) Lab data plus stored samples 26 July 2018 3
High reports of unintended pregnancy (at last conception) Variations by site (P <0.001) 90 81.9% 80 70 (n=249) 57.5% Percentage (%) 55.7% 60 51.2% 49.9% 50 41.9% 40.6% 40 (n=271) (n=175) 29.8% 28.7% (n=179) (N=1,985) 30 (n=94) (n=322) 20 (n=343) (n=352) 10 0 Kampala Harare St. Mary's Seke North Blantyre Lilongwe Soweto Durban Uganda Zimbabwe Malawi South Africa Total Unintended pregnancy/wanted to delay pregnancy 26 July 2018 4
Contraceptive use by country Variations by site (P <0.001) 60 56.1 50 Injectable Condoms Implant Oral Tubal ligation IUCD Hysterectomy Other* 44.1 43.1 40.6 40.1 40 Percentage (%) 29.9 30 22.1 21.2 20.5 19.3 19.5 20 16.8 15.7 12 15.4 12.1 11.4 9.4 9.9 8.1 10 7.7 6.3 3 2.4 2 1.9 1.7 1.5 1.3 1.2 1 0.60 0.5 0.3 0 0 South Africa Malawi Uganda Zimbabwe Total 26 July 2018 5
Use of Effective Family Planning (EFP) and Long Acting Reversible Contraceptive (LARC) methods EFP use LARC use 100 P =<0.001 EFP methods (injectable, oral, intra- uterine device (IUD), implant, or tubal- ligation).1 87.8 90 82.6 79.9 76 80 68.9 Percentage (%) 70 LARC methods (implants or IUD) are the most effective, and suitable for women who report infrequent sex, or hormonal side-effects.2 60 50 P =<0.001 40 30 24.1 22.3 18.8 15.3 20 10.4 10 0 Zimbabwe South Africa Malawi Uganda Total Department of Economic and Social Affairs PDUN. Trends in contraceptive use worldwide 2015. Contraception. 2015: Darroch JE et al, Lancet 2013; Darroch JE et al, Responding to Women s Needs. New York: Guttmacher Institute; 2011 26 July 2018 6
Baseline characteristics (by reported EFP use at study entry) Demographic and socioeconomic factors P value Characteristic Overall (N=1,295) 31 [28-35] EFP use (n=1,054) 31 [28-35] No EFP use (n=241) 30 [26-35] 0.077 Maternal-age (years), median [IQR] Married/regular partner, n (%) Unintended pregnancy, n (%) Desire another children, n (%) No sex in the last 3 months, n (%) 1,140 (88.0%) 662 (51.2%) 490 (37.9%) 126 (9.7%) 930 (88.2%) 560 (53.2%) 369 (35.0%) 120 (11.4%) 210 (87.1%) 102 (42.5%) 121 (50.4%) 6 (2.5%) 81 (33.8%) 0.936 0.01 <0.001 <0.001 0.588 Clinic travel time 1 hour (yes), n (%) 365 (28.2%) 284 (26.9%) Education (completed primary), n(%) Unemployed/housewife, n (%) 1,007 (77.8%) 588 (45.5%) 818 (77.6%) 477 (45.3%) 189 (78.4%) 111 (46.1%) 171 (71.0%) 0.029 0.531 0.173 Electricity in household, n(%) 894 (69.0%) 723 (68.6%) 235 (97.5%) 0.844 Currently on ART, n (%) 1,265 (97.7%) 1,030 (97.7%) 13 (5.7%) 0.029 Viral load (>1,000 copies/ml), n (%) 112 (8.9%) 99 (9.6%) 26 July 2018 7
Correlates of EFP and LARC use at PROMOTE study baseline EFP use LARC use Adjusted RR (95% CI) 1.05 (0.99-1.11) P value Adjusted RR (95% CI) 1.18 (0.93-1.49) P value 0.086 0.174 Unintended pregnancy 0.92 (0.87-0.99) 0.017 1.05 (0.81-1.37) 0.703 Desire another child 0.81 (0.76-0.87) <0.001 0.90 (0.61-1.32) 0.582 No sex in last 3 months 1.10 (0.99-1.20) 0.064 0.86 (0.61-1.20) 0.365 Married 0.92 (0.85-0.99) 0.03 0.83 (0.61-1.11) 0.202 Not completed primary school 0.94 (0.88-1.00) 0.066 0.66 (0.48-0.91) 0.011 Housewife/ no formal income 0.97 (0.91-1.04) 0.419 1.33 (1.01-1.76) 0.04 Electricity in household, yes 0.97 (0.91-1.04) 0.401 0.90 (0.68-1.20) 0.486 Clinic travel time 1 hour Viral load, 1000 copies/ml 1.10 (1.02-1.19) 0.013 1.64 (1.20-2.23) 0.002 Modified Poisson regression (robust variance estimator); adjusted for age and country 26 July 2018 8
Conclusion Future plans/ policy implications Planned PROMOTE cohort analyses Incidence and correlates of unintended pregnancy through 18 months follow-up Interactions between ART (efavirenz) and hormonal contraceptives and risk of unintended pregnancy (quantitative measures of ART and exogenous hormonal levels on stored samples) Policy considerations for HIV infected women on ART In this large multinational cohort of HIV infected African women on life-long ART we observed the following at baseline: a) High prevalence of reported unintended pregnancy (at last conception) b) About 20% women reported use of non-EFP methods, and only about 20% reported use of LARC methods. There were site variations, with a trend towards one predominant method at site level. c) Unintended pregnancy at last conception was NOT associated with use of EFP or LARC methods. Risk of neural tube defects with dolutegravir Tsepamo study, May 2018, and WHO rapid memo 26 July 2018 9
Acknowledgements THE PROMOTE PROTOCOL TEAM GRATEFULLY ACKNOWLEDGES THE DEDICATION THE PROMOTE PROTOCOL TEAM GRATEFULLY ACKNOWLEDGES THE DEDICATION AND COMMITMENT OF THE MORE THAN 1,900 STUDY MOTHERS COMMITMENT OF THE MORE THAN 1,900 STUDY MOTHERS AND Sponsors: US PEPFAR (Nareen Abboud) Protocol Chairs : Taha Taha, MG Fowler Statistical and Data Management Center: N, Yende, P Radebe, S Brummel, A Jeewa, N Hua Site PROMOTE Investigators: Blantyre, Malawi B Makanani Lilongwe, Malawi L Chinula Kampala, Uganda M Owor Harare, Zimbabwe T Chipato Soweto, South Africa ME Nyati Durban, South Africa S Hanley
Baseline characteristics (ART regimens used at study entry) EFV/TDF/3TC or FTC LPV/r/TDF/3TC Other 3.4 8.6 100 0.4 12.3 8.1 1.6 9.7 12.5 0.8 1.1 90 22.8 1.5 Proportion of ART type (%) 80 70 60 51 50 98.8 95 91.9 90.3 90.3 87.5 86.2 40 30 20 26.2 10 0 Seke North St. Mary's Harare FC Umlazi Soweto Lilongwe Blantyre MUJHU Zimbabwe South Africa Malawi Uganda 26 July 2018 11
Correlates of EFP and LARC use at PROMOTE study baseline EFP use LARC use Adjusted RR (95% CI) 1.05 (0.99-1.11) P value Adjusted RR (95% CI) 1.18 (0.93-1.49) P value 0.086 0.174 Unintended pregnancy 0.92 (0.87-0.99) 0.017 1.05 (0.81-1.37) 0.703 Desire another child 0.81 (0.76-0.87) <0.001 0.90 (0.61-1.32) 0.582 No sex in last 3 months 1.10 (0.99-1.20) 0.064 0.86 (0.61-1.20) 0.365 Married 0.92 (0.85-0.99) 0.03 0.83 (0.61-1.11) 0.202 Not completed primary school 0.94 (0.88-1.00) 0.066 0.66 (0.48-0.91) 0.011 Housewife/ no formal income 0.97 (0.91-1.04) 0.419 1.33 (1.01-1.76) 0.04 Electricity in household, yes 0.97 (0.91-1.04) 0.401 0.90 (0.68-1.20) 0.486 Clinic travel time 1 hour Viral load, 1000 copies/ml Modified Poisson regression (robust variance estimator); adjusted for age and country 1.10 (1.02-1.19) 0.013 1.64 (1.20-2.23) 0.002 26 July 2018 12
