Herefordshire Cost of Living Monthly Monitoring Report December 2023
The Herefordshire Cost of Living Monthly Monitoring Report for December 2023 provides key points on inflation rates, Universal Credit claimants, and job postings. Inflation rates, including CPIH and CPI, fell slightly in November. The number of people claiming Universal Credit has seen a gradual increase. The report offers insights into the economic trends and changes affecting Herefordshire residents.
Download Presentation

Please find below an Image/Link to download the presentation.
The content on the website is provided AS IS for your information and personal use only. It may not be sold, licensed, or shared on other websites without obtaining consent from the author.If you encounter any issues during the download, it is possible that the publisher has removed the file from their server.
You are allowed to download the files provided on this website for personal or commercial use, subject to the condition that they are used lawfully. All files are the property of their respective owners.
The content on the website is provided AS IS for your information and personal use only. It may not be sold, licensed, or shared on other websites without obtaining consent from the author.
E N D
Presentation Transcript
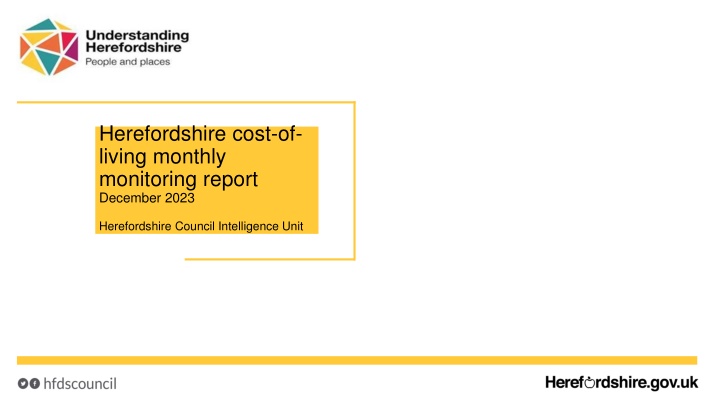
Herefordshire cost-of- living monthly monitoring report December 2023 Herefordshire Council Intelligence Unit
About the monthly monitoring report The monthly monitoring report is a supplementary report to the quarterly Cost-of-Living Bulletin and provides the latest data from the limited number of datasets that are updated on a monthly basis. If you need help to understand this document, or would like it in another format or language, please contact us on 01432 261944 or e-mail researchteam@herefordshire.gov.uk
Key points The rate of Inflation fell more than expected in November 2023 - the Consumer Prices Index (CPI) rose by 3.9% in the 12 months to November 2023; down from 4.6% in October; the lowest rate since autumn 2021. The number of people claiming Universal Credit is gradually increasing and is significantly higher than the pandemic peak. The number of people claiming out-of-work related benefits increased in November 2023 and numbers remain significantly higher than pre-pandemic. The number of unique job postings rose slightly in November 2023 and was similar to the same month last year but higher than immediately prior to the Covid-19 pandemic.
Inflation Key points ONS reports that the Consumer Prices Index including owner occupiers' housing costs (CPIH) rose by 4.2% in the 12 months to November 2023, down from 4.7% in October. On a monthly basis, CPIH fell by 0.1% in November 2023, compared with a rise of 0.4% in November 2022. The Consumer Prices Index (CPI) rose by 3.9% in the 12 months to November 2023, down from 4.6% in October. On a monthly basis, CPI fell by 0.2% in November 2023, compared with a rise of 0.4% in November 2022. . The largest downward contributions to the monthly change in both CPIH and CPI annual rates came from transport, recreation and culture, and food and non-alcoholic beverages. Core CPIH (excluding energy, food, alcohol and tobacco) rose by 5.2% in the 12 months to November 2023, down from 5.6% in October; the CPIH goods annual rate slowed from 2.9% to 2.0%, while the CPIH services annual rate eased from 6.2% to 6.0%. Core CPI (excluding energy, food, alcohol and tobacco) rose by 5.1% in the 12 months to November 2023, down from 5.7% in October; the CPI goods annual rate slowed from 2.9% to 2.0%, while the CPI services annual rate eased from 6.6% to 6.3%. Need to know: The Consumer Prices Index including owner occupiers' housing costs (CPIH) is the lead and most comprehensive measure of consumer price inflation CPIH includes a measure of the costs associated with owning, maintaining and living in one's own home, known as owner occupiers' housing costs (OOH), along with Council Tax. Both are significant expenses for many households and are not included in the CPI. However, the Consumer Prices Index (CPI) is based on a harmonised methodology developed by Eurostat and allows for international comparisons to be drawn. Source: ONS Last updated: 20 December 2023 Frequency of update: Monthly Next update: 17 January 2024
People claiming Universal Credit (UC) Key points The number of people claiming the Universal Credit (UC) doubled between March 2020 and May 2020. Since then claimant numbers have remained at a high level and are currently on a gradual upward trend. Provisional data suggest there were 12,880 Universal Credit in claimants in Herefordshire in November 2023: an increase of 184 from August and more than the pandemic peak of 12,382 in April 2021. In Herefordshire, UC claimants currently comprise 12% of the working age population; lower than the West Midlands Region (17%) and England (15%) but still more than double the 5% seen in March 2020. The wards with the highest number of UC claimants were Hinton & Hunderton (775) and Newton Farm (669) followed by Leominster East (513), and Widemarsh (503). In August 2023, there were 10,745 households in Herefordshire claiming Universal Credit, slightly up from 10,695 in July 2023 (both provisional) . Of these households over a half (5,495) contained at least one child. Data source: Department for Work & Pensions (Stat-Xplore) Last updated: 13 December 2023 Frequency of update: Monthly Next update: 16 January 2024 Need to know: The monthly number of people on Universal Credit includes all individuals who have an open claim on the count date for the month. Some people will have their claim terminated either at the request of the individual or if their entitlement to Universal Credit ends. If a termination is recorded, but the person is still receiving a payment, then the claim will still be classed as live at the end of each reporting month. The latest month's figures are provisional and are subject to change in the next publication where they will be revised and finalised. Monthly figures are currently not subject to retrospection beyond the first revision.
Out-of-work related claimant count: all ages Key points 2,505 people aged 16+ in Herefordshire were claiming unemployment related benefits* in November 2023: up from the previous month by 70 claimants. Numbers remain significantly higher than pre-pandemic levels, being 19% higher than in March 2020; a smaller increase than in England as a whole (27%). There are currently around 690 fewer claimants than the peak in the aftermath of the Great Recession (February 2012). The claimant count rate a proportion of residents aged 16-64 was 2.3% in November 2023 compared to 3.8% for England and 4.9% for the West Midlands region. What this doesn t tell us: Claimant count is NOT a full measure of unemployment, but it is the most timely indicator. From these data, we do not know which industry sector(s) any increases or decreases are being driven by. Data source: ONS - NOMIS Date last updated: 12 December 2023 Frequency of update: Monthly Next update: 16 January 2024 Need to know *Includes people claiming Jobseeker's Allowance plus those claiming Universal Credit who are required to seek and be available for work. Month-by-month comparisons are difficult as previous data is often revised
Out-of-work claimant count by ward Key points Generally, those wards with the highest numbers of claimants before the pandemic still have the highest numbers now. In November 2023, the wards with the highest numbers of claimants were Hinton & Hunderton (160), Widemarsh (120), Newton Farm (110) and Leominster East (105). The largest proportional increases in the claimant count since March 2020 have occurred in Kerne Bridge (100%), Ledbury South (83%) and Dinedor Hill (80%). In terms of numerical increases, the largest have been in Widemarsh (40 claimants), Hinton & Hunderton (30) and Ledbury South (25). Data source: ONS - NOMIS Date last updated: 12 December 2023 Frequency of update: Monthly Next update: 16 January 2024
Age distribution of out-of-work claimants Key points Since before the start of the Financial Crisis in January 2008, the age distribution of claimants has changed significantly. Before the Financial Crisis (January 2008), 18 to 24 year olds accounted for 27% of claimants and over 50s accounted for 19% of claimants. By November 2023 (the latest data available), 18 to 24 year-olds accounted for 18% of claimants and over 50s 27% of claimants reversing the distribution at the start of the period. This trend is partly a reflection of our ageing workforce but may also be an indicator of discrimination in the labour market whereby older workers who want to work find it harder to find another job than they did in the past. Recent IFS research suggests that nationally many older workers were forced out of employment (through the jobs they were in not being compatible with home working and/or health fears) during the COVID-19 pandemic and that people who become inactive at older ages often never re-enter the workforce. Recent IFS research NOMIS Data source: ONS - NOMIS Date last updated: 12 December 2023 Frequency of update: Monthly Next update: 16 January 2024
Job postings Key points In Herefordshire, during the period December 2022 to November 2023 there were 58,387 job postings, of which 22,849 were unique. The number of unique posting rose in November 2023 to 3,907: up from 3,709 in October (+5%) (revised). Looking at the past 5 years of data, posting levels remain at a relatively high level and in November 2023 were similar to a year ago (3,880 in November 2022), but higher than immediately before the first pandemic lockdown (3,454 in February 2020). The top ten posted occupations (SOC 3 level) in the period December 2022 to November 2023 were caring personal services (1,840 unique postings), sales related occupations (924), nursing professionals (882), and other elementary services occupations (859). Top posted job titles in this period were support workers (805 unique postings), healthcare assistants (296), cleaners (261) and care assistants (246). The most in-demand specialized skills in this period (by frequency in job postings) were auditing, finance and personal care. Need to know: A unique job posting is one that has been de-duplicated as postings can appear on multiple websites, multiple times. Data include voluntary, internships, side jobs and freelance. The Standard Occupational Classification (SOC) is a common classification of occupational information for the UK and comprises 4 tiers with 4 being the most detailed. Source: Lightcast (EMSI): economicmodelling.co.uk Date last updated: 4 December 2023 Frequency of update: Monthly Next update: January 2024
In-demand skills Top 10 hard skills by quarter Top hard skills (November 2021 November 2023) Need to know: Hard skills are abilities that have been taught to or learnt by a person. Source: Lightcast (EMSI): economicmodelling.co.uk Date last updated: 4 December 2023 Frequency of update: Monthly Next update: January 2024
Hard to fill vacancies Key points Median Posting Duration from Dec 2022 - Nov 2023 Unique Postings from Dec 2022 - Nov 2023 Avg. Posting Intensity (Dec 2022 - Nov 2023) SOC Occupation There is no standard definition of a hard- to-fill vacancy but the table below shows those occupations (SOC 3 level) for the period December 2022 to November 2023 with a higher than average posting intensity. Those which also have a higher than average median posting duration (highlighted in red) are likely to be those most difficult to fill (table is in ascending order of difficulty).. 223 116 117 613 924 221 115 225 525 713 216 222 821 913 322 812 Nursing Professionals Senior Officers in Protective Services Health and Social Services Managers and Directors Caring Personal Services Elementary Sales Occupations Medical Practitioners Managers and Directors in Retail and Wholesale Other Health Professionals Skilled Metal, Electrical and Electronic Trades Supervisors Shopkeepers and Sales Supervisors Research and Development (R&D) and Other Research Professionals3 Therapy Professionals Road Transport Drivers Elementary Process Plant Occupations Welfare and Housing Associate Professionals Metal Working Machine Operatives 30 20 33 31 23 37 34 33 33 32 31 31 29 29 27 0 882 19 267 7 : 1 7 : 1 6 : 1 5 : 1 5 : 1 4 : 1 4 : 1 4 : 1 4 : 1 4 : 1 4 : 1 4 : 1 4 : 1 4 : 1 4 : 1 4 : 1 1,840 52 239 347 237 83 156 45 270 550 76 330 This is the most timely proxy for hard-to- fill vacancies and although there are some issues associated with this methodology, it has been shown to be a robust approximation. 2 Source: Lightcast (EMSI): economicmodelling.co.uk Date last updated: 4 December 2023 Frequency of update: Monthly Next update: January 2024 Need to know: Posting Intensity is a ratio of total job postings to unique, or de-duplicated, job postings. A higher than average posting intensity can mean that employers are putting more effort than normal into hiring that position. Posting intensity is available by occupation, by job title, by company, and by region. The median posting duration (how long a posting was live before it was taken down) can be compared to the regional average for all postings in the region, giving an indication of whether these positions are harder or easier to fill than the typical job posting.
