Hawaii Medicaid Enrollment Data Update
Analyzing the latest Hawaii Department of Human Services data update from 7/12/2021 reveals insights on weekly applications, Medicaid applications, enrollments, and percentage increases by county. The data showcases weekly application trends, Medicaid applications received per week, monthly enrollment figures, current Medicaid enrollment by county with percentage increases, and a summary since March 6, 2020, highlighting total Medicaid applications received, new enrollments, and the percentage of applications eligible for Medicaid.

Download Presentation

Please find below an Image/Link to download the presentation.
The content on the website is provided AS IS for your information and personal use only. It may not be sold, licensed, or shared on other websites without obtaining consent from the author.If you encounter any issues during the download, it is possible that the publisher has removed the file from their server.
You are allowed to download the files provided on this website for personal or commercial use, subject to the condition that they are used lawfully. All files are the property of their respective owners.
The content on the website is provided AS IS for your information and personal use only. It may not be sold, licensed, or shared on other websites without obtaining consent from the author.
E N D
Presentation Transcript
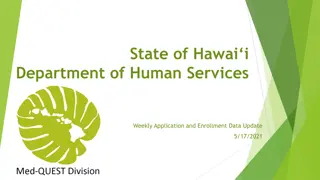
State of Hawaii Department of Human Services Weekly Application and Enrollment Data Update 7/12/2021
Increase in weekly applications received by County from the year before the pandemic (March 2019 February 2020) compared to the period since March 2020 County Average Weekly Application Count Year Before Pandemic Average Weekly Application Count Since March 2020 Average Percentage Increase in Applications Honolulu 884 1019 15% Maui 198 265 34% Hawai i 264 263 0% Kaua i 89 111 25% Statewide 1,435 1,657 15%
Hawai'i Medicaid Applications Received Per Week 3500 3000 Number of Applications Received 2500 2000 1500 1000 500 1/3 1/10 1/17 1/24 1/31 2/7 2/14 2/21 2/28 3/7 3/14 3/21 3/28 4/4 4/11 4/18 4/25 5/2 5/9 5/16 5/23 5/30 6/6 6/13 6/20 6/27 7/4 7/11 7/18 7/25 8/1 8/8 8/15 8/22 8/29 9/5 9/12 9/19 9/26 10/3 10/10 10/17 10/24 10/31 11/7 11/14 11/21 11/28 12/5 12/12 12/19 12/26 Week Beginning Based on 2021 Date and Corresponding Weeks From Previous Years 2019 2020 2021 Application increase in Nov-Dec reflects additional application activity due to the Federal Marketplace open enrollment period.
Hawaii Medicaid Monthly Enrollment: January 2019 to present 94,020 New Enrollments since 3/6/2020 (28% Increase) 425,000 421,139 400,000 375,000 350,000 325,000 327,119 300,000 Total Enrollment, Hawaii Medicaid (Jan 2019 - Present)
Current Medicaid enrollment by County and Percentage increase in enrollments since March 6, 2020 25,565 33% increase 255,662 29% increase 53,992 35% increase 85,920 23% increase
Since March 6, 2020: Total Medicaid Applications Received: 116572 Total New Medicaid Enrollments: 94,020 Percentage of Applications Eligible for Medicaid: 80.6%