Harvard Forest Schoolyard Ecology Data Analysis Workshop 2016


Teacher Developed Graphs and Data Documents
Harvard Forest Schoolyard Ecology
Looking at Data Workshop 2016
Compiled by Pamela Snow
Schoolyard Ecology Teachers:
Maryanne Rotelli, Sally Farrow, Jennifer Woodard, Erin Pitkin,
Robin Koval, Colleen Casey, Lori Primavera, Louise Levy, Elisa Margarita
Harvard Forest Staff and Mentors:
Betsy Colburn, John O’Keefe, Emery Boose, David Orwig, Greta VanScoy, Luca Morreale, Joshua Rapp,
Matthew Lau, Matthew Duvenick
Graph 1
: Comparison of Tree Species by Plot
•
Description of graph and
related data table:
Stacked
bar graph comparing number
of trees by species in two plots.
•
Teacher/Author:
Maryanne
Rotelli
•
School:
Brookline-Hollis High
School (NH)
•
Grade Level:
11,12
•
Harvard Forest Mentor:
Marissa McBride
Graph 2
: Comparison of Number of Tree Species by Plot
•
Description of graph:
Bar Graph showing
Number of Individual
Tree Species by Plot
•
Teacher/Author:
Maryanne Rotelli
•
School:
Brookline-Hollis
High School (NH)
•
Grade Level:
11,12
•
Harvard Forest Mentor:
Marissa McBride
Graph 3
: Comparison of Carbon Biomass by Plot
•
Description of graph:
Bar graph of carbon
biomass by plot.
•
Teacher/Author:
Maryanne Rotelli
•
School:
Brookline-Hollis
High School (NH)
•
Grade Level:
11,12
•
Harvard Forest Mentor:
Marissa McBride
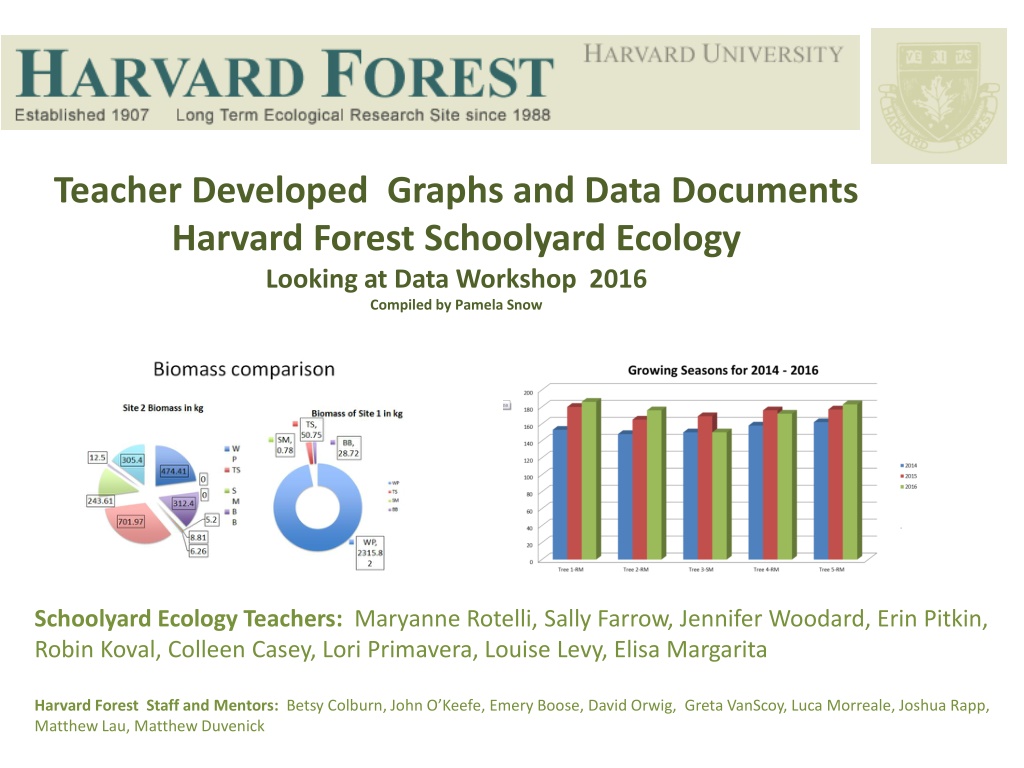
Graph 4
: Biomass Comparison by Plot
•
Description of graph:
Pie chart comparison of
biomass by species and
plot.
•
Teacher/Author:
Maryanne Rotelli
•
School:
•
Brookline-Hollis High
School (NH)
•
Grade Level:
11,12
•
Harvard Forest Mentor:
Marissa McBride
Graph 5
: Air Temperatures at 8 Ponds Over 7 Years
•
Description of graph
:
Line graph
showing
average air
temperature in spring
compared across 8
ponds.
•
Teachers/Authors:
Sally Farrow
Jennifer Woodard
Erin Pitkin
•
Site:
Drumlin Farm
•
X Axis
: Year
•
Y Axis:
Temperature in
Degrees Celsius
•
Grade Level:
1-12
•
Harvard Forest
Mentor:
Matthew Duvenick
Average
Spring
Air Temp at 8 Ponds
Graph 6
: Timing of Leaf Drop from 2013-2016
•
Description of graph
: Line
graph of leaf drop over three
years.
•
X Axis:
Julian Date
•
Y Axis:
Percent Leaves Fallen
•
Teacher/Author:
Robin Koval
•
School:
Shore Country Day
School
•
Grade Level:
7,9
•
Harvard Forest Mentor:
Greta VanScoy
Graph 7
:
•
Description of
graph:
Scatter plot
of growing season
length over 3 years.
•
X Axis:
Year
•
Y Axis:
Length of
Growing Season in
Julian Days
•
Teacher/Author:
Robin Koval
•
School:
Shore
Country Day School
•
Grade Level:
7,9
Length of Growing Season Over Three Years
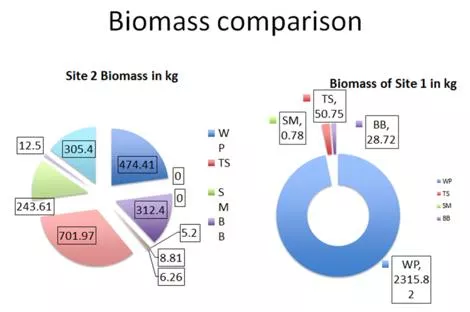
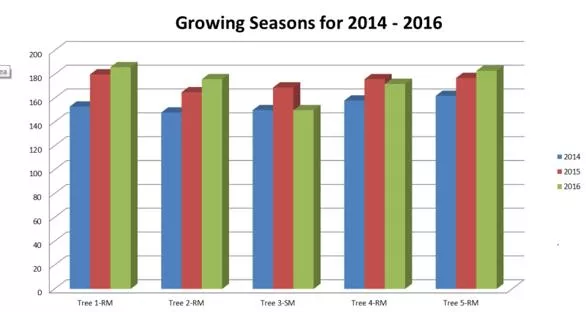
Graph 8
: Growing Season At Trinity Catholic Academy
2014-2016
•
Description of graph:
Bar graph of length of
growing season at Trinity
Catholic Academy over
three years.
•
X Axis:
Tree ID Number
•
Y Axis:
Number of Days
•
Teacher/Author:
Colleen Casey
Lori Primavera
•
School:
Trinity Catholic
Academy
•
Grade Level:
4
th
and 5
th
•
Educational Objectives
:
Our students are studying
the bud burst and leaf fall of 5 trees here on our
campus. Here is three years of our data to show the
change in our growing season which is the time when
the tree is photosynthesizing.
Graph 9
: Timing of Budburst from 2014 to 2016
•
Description of graph:
This
bar graph illustrates the
average time of spring bud
burst over the last 3 years.
Bar colors represent different
years.
•
X Axis:
Tree ID Number
•
Y Axis:
Date
•
Teacher/Author:
Colleen Casey
Lori Primavera
•
School:
Trinity Catholic
Academy
•
Grade Level:
4
th
and 5
th
•
Educational Objectives
:
Our students are studying the
bud burst and leaf fall of 5 trees
here on our campus. Here is
three years of our data to show
the change in
timing of buds
opening in Spring.
Graph 10
: Timing of Leaf Drop from 2013 to 2016
•
Description of graph:
This
bar
graph reflects the
average date in which the
leaves fell for each year.
•
X Axis:
Tree ID Number
•
Y Axis:
Date
•
Teacher/Author:
Colleen Casey
Lori Primavera
•
School:
Trinity Catholic
Academy
•
Grade Level:
4
th
and 5
th
•
Educational Objectives
:
Our
Students are collecting
data from 5 tress located on
the grounds of Trinity
Catholic Academy
. This graph
helps students see what the
data is showing for the timing
of leaf fall at our school.
Graph 11
: Timing of Leaf Drop of Red Maples at Two
Field Sites at Belchertown High School
•
Description of graph:
Line
graph comparing the
timing of leaf drop of Red
Maples between 2 field
sites at Belchertown High
School.
•
Teacher/Author:
Louise Levy
•
School:
Belchertown High
School
•
Grade Level:
11,12
•
Educational Objectives:
In conjunction with field
site visits and
characterization, students
will assess any differences
between the leaf drop of
two same-species trees
and posit the causes for
those differences.
Graph 12
: Timing of Red Oak Leaf Fall Compared Across 2
Field Sites at Belchertown High School
•
Description of graph:
Line Graph comparing
Red Oak leaf drop at 2
study sites at
Belchertown High
School.
•
Teacher/Author:
Louise Levy
•
School:
Belchertown High
School
•
Grade Level:
11, 12
•
Educational Objectives:
In conjunction with field
site visits and
characterization, students
will assess any differences
between the leaf drop of
two same-species trees
and posit the causes for
those differences
.
Graph 13
:
•
Description of graph:
Line
graph of timing leaf drop on
Gray Birch in 2 field sites at
Belchertown High School.
•
Teacher/Author:
Louise Levy
•
School:
Belchertown
High School
•
Grade Level:
11,12
•
Educational Objectives:
I
n
conjunction with field site visits
and characterization, students
will assess any differences
between the leaf drop of two
same-species trees and posit the
causes for those differences
.
Timing of Leaf Drop on Grey Birches at 2 field
Sites at Belchertown High School
•
X Axis:
Julian Date
•
Y Axis:
Percent
Leaf Drop
•
Teacher/Author
Elisa Margarita
•
School:
Brooklyn Technical
High School
Graph 14
:
Timing of Leaf Drop of 2 Willow Oaks at
Brooklyn Technical High School
Addendum to Looking at Data
Graphs, 2016
Data Tables 1-6
Data Table 1
Data for Graph #6
Robin Koval
*
Original Data Table for graph 6 is 143 lines long. Rest of Table is available via email at psnow@fas.harvared.edu
Data Table 2
Data for Graph #7
Robin Koval
Data Table 3
Data for Graph #11
Louise Levy
Data Table 4
Data for Graph #12
Louise Levy
Data Table 5
Data for Graph #13
Louise Levy
Data Table 6
Data for Graph #14
Elisa Margarita
Compilation of teacher-developed graphs and data documents from the Harvard Forest Schoolyard Ecology Workshop 2016. The documents include comparisons of tree species by plot, number of tree species, carbon biomass, and biomass distribution across different species and plots. Additionally, the analysis includes air temperature trends at various ponds over seven years. The data was compiled and presented by various teachers and mentors involved in the workshop.

Download Presentation

Please find below an Image/Link to download the presentation.
The content on the website is provided AS IS for your information and personal use only. It may not be sold, licensed, or shared on other websites without obtaining consent from the author. Download presentation by click this link. If you encounter any issues during the download, it is possible that the publisher has removed the file from their server.
E N D
Presentation Transcript
Teacher Developed Graphs and Data Documents Harvard Forest Schoolyard Ecology Looking at Data Workshop 2016 Compiled by Pamela Snow Schoolyard Ecology Teachers: Maryanne Rotelli, Sally Farrow, Jennifer Woodard, Erin Pitkin, Robin Koval, Colleen Casey, Lori Primavera, Louise Levy, Elisa Margarita Harvard Forest Staff and Mentors: Betsy Colburn, John O Keefe, Emery Boose, David Orwig, Greta VanScoy, Luca Morreale, Joshua Rapp, Matthew Lau, Matthew Duvenick
Graph 1: Comparison of Tree Species by Plot Description of graph and related data table: Stacked bar graph comparing number of trees by species in two plots. Comparison of the Number of Individual Tree Species by Plot Site 20 19 18 17 WP Number of Individuals Teacher/Author: Maryanne Rotelli 16 TS 15 14 TA 13 12 SM 11 School: Brookline-Hollis High School (NH) 10 RO 9 RM 8 7 GB 6 5 FD Grade Level: 11,12 4 3 EL 2 BC 1 Harvard Forest Mentor: Marissa McBride 0 BB Site 1 Site 2 Site Number
Graph 2: Comparison of Number of Tree Species by Plot Description of graph: Bar Graph showing Number of Individual Tree Species by Plot Teacher/Author: Maryanne Rotelli School: Brookline-Hollis High School (NH) Grade Level: 11,12 Harvard Forest Mentor: Marissa McBride
Graph 3: Comparison of Carbon Biomass by Plot Description of graph: Bar graph of carbon biomass by plot. Teacher/Author: Maryanne Rotelli School: Brookline-Hollis High School (NH) Grade Level: 11,12 Harvard Forest Mentor: Marissa McBride
Graph 4: Biomass Comparison by Plot Description of graph: Pie chart comparison of biomass by species and plot. Maryanne Rotelli Teacher/Author: School: Brookline-Hollis High School (NH) Grade Level: 11,12 Harvard Forest Mentor: Marissa McBride
Graph 5: Air Temperatures at 8 Ponds Over 7 Years Description of graph: Line graphshowing average air temperature in spring compared across 8 ponds. Average Spring Air Temp at 8 Ponds Sally Farrow Jennifer Woodard Erin Pitkin Teachers/Authors: Site: Drumlin Farm X Axis: Year Y Axis: Temperature in Degrees Celsius Grade Level: 1-12 Harvard Forest Mentor: Matthew Duvenick
Graph 6: Timing of Leaf Drop from 2013-2016 Description of graph: Line graph of leaf drop over three years. % leaf drop from 2013-16 100 X Axis: Julian Date Y Axis: Percent Leaves Fallen 90 80 70 % leaves fallen Teacher/Author: Robin Koval 60 2013 50 2014 40 2015 School: Shore Country Day School 2016 30 20 10 Grade Level: 7,9 0 250 260 270 280 290 300 310 320 Julian date Harvard Forest Mentor: Greta VanScoy
Length of Growing Season Over Three Years Graph 7 : Description of graph: Scatter plot of growing season length over 3 years. Growing season length (number of days) 190 180 X Axis: Year Y Axis: Length of Growing Season in Julian Days Julian Day 170 Growing season length (number of days) Teacher/Author: Robin Koval 160 School: Shore Country Day School 150 2013 2014 2015 2016 2017 year Grade Level: 7,9
Graph 8 : Growing Season At Trinity Catholic Academy 2014-2016 Description of graph: Bar graph of length of growing season at Trinity Catholic Academy over three years. X Axis: Tree ID Number Y Axis: Number of Days Teacher/Author: Colleen Casey Lori Primavera School: Trinity Catholic Academy Grade Level:4th and 5th Educational Objectives: Our students are studying the bud burst and leaf fall of 5 trees here on our campus. Here is three years of our data to show the change in our growing season which is the time when the tree is photosynthesizing.
Graph 9 : Timing of Budburst from 2014 to 2016 Thisbar graph illustrates the average time of spring bud burst over the last 3 years. Bar colors represent different years. Description of graph: X Axis: Tree ID Number Y Axis: Date Teacher/Author: Colleen Casey Lori Primavera School: Trinity Catholic Academy Grade Level:4th and 5th Educational Objectives: Our students are studying the bud burst and leaf fall of 5 trees here on our campus. Here is three years of our data to show the change in timing of buds opening in Spring.
Graph 10 : Timing of Leaf Drop from 2013 to 2016 This bar graph reflects the average date in which the leaves fell for each year. Description of graph: X Axis: Tree ID Number Y Axis: Date Teacher/Author: Colleen Casey Lori Primavera School: Trinity Catholic Academy Grade Level:4th and 5th Educational Objectives: Our Students are collecting data from 5 tress located on the grounds of Trinity Catholic Academy. This graph helps students see what the data is showing for the timing of leaf fall at our school.
Graph 11 : Timing of Leaf Drop of Red Maples at Two Field Sites at Belchertown High School Description of graph: Line graph comparing the timing of leaf drop of Red Maples between 2 field sites at Belchertown High School. Teacher/Author: Louise Levy School: Belchertown High School Grade Level: 11,12 Educational Objectives: In conjunction with field site visits and characterization, students will assess any differences between the leaf drop of two same-species trees and posit the causes for those differences.
Graph 12 : Timing of Red Oak Leaf Fall Compared Across 2 Field Sites at Belchertown High School Description of graph: Line Graph comparing Red Oak leaf drop at 2 study sites at Belchertown High School. Teacher/Author: Louise Levy School: Belchertown High School Grade Level: 11, 12 Educational Objectives: In conjunction with field site visits and characterization, students will assess any differences between the leaf drop of two same-species trees and posit the causes for those differences.
Timing of Leaf Drop on Grey Birches at 2 field Sites at Belchertown High School Graph 13 : Description of graph: Line graph of timing leaf drop on Gray Birch in 2 field sites at Belchertown High School. Teacher/Author: Louise Levy School: Belchertown High School Grade Level:11,12 Educational Objectives: In conjunction with field site visits and characterization, students will assess any differences between the leaf drop of two same-species trees and posit the causes for those differences.
Graph 14 :Timing of Leaf Drop of 2 Willow Oaks at Brooklyn Technical High School X Axis: Julian Date Y Axis: Percent Leaf Drop Teacher/Author Elisa Margarita School: Brooklyn Technical High School
Addendum to Looking at Data Graphs, 2016 Data Tables 1-6
Data Table 1 Data for Graph #6 Robin Koval Site Code SCM-buds-001 Koval SCM-buds-001 Koval SCM-buds-001 Koval SCM-buds-001 Koval SCM-buds-001 Koval SCM-buds-001 Koval SCM-buds-001 Koval SCM-buds-001 Koval SCM-buds-001 Koval SCM-buds-001 Koval SCM-buds-001 Koval SCM-buds-001 Koval SCM-buds-001 Koval SCM-buds-001 Koval SCM-buds-001 Koval SCM-buds-001 Koval SCM-buds-001 Koval SCM-buds-001 Koval SCM-buds-001 Koval SCM-buds-001 Koval SCM-buds-001 Koval Teacher Date 9/25/2013 10/2/2013 10/10/2013 10/15/2013 10/22/2013 11/1/2013 9/24/2014 10/1/2014 10/7/2014 10/17/2014 10/24/2014 9/22/2015 10/2/2015 10/7/2015 10/24/2015 10/30/2015 9/9/2016 9/19/2016 9/30/2016 10/7/2016 10/17/2016 Julian Tree ID Species CodeTotal Leaves Fallen LeavesTree Color 1 TP 12 1 TP 12 1 TP 12 1 TP 12 1 TP 12 1 TP 12 1 TP 1 TP 1 TP 1 TP 1 TP 1 TP 1 TP 1 TP 1 TP 1 TP 1 TP 1 TP 1 TP 1 TP 1 TP % leaves fallen 268 275 283 288 295 305 267 274 280 290 297 265 275 280 297 303 253 263 274 281 291 0 0 1 4 7 1 1 3 8.33333333 3 33.3333333 4 58.3333333 4 1 2 2 4 66.6666667 4 1 1 1 3 66.6666667 3 66.6666667 1 1 2 2 16.6666667 3 0 0 12 0 0 0 4 6 0 0 0 4 4 0 0 0 1 3 100 6 6 6 6 6 6 6 6 6 6 6 6 6 6 6 0 0 0 100 0 0 0 0 0 0 50 *Original Data Table for graph 6 is 143 lines long. Rest of Table is available via email at psnow@fas.harvared.edu
Data Table 2 Data for Graph #7 Robin Koval 2016 INSERT YOUR SPRING AND FALL DATA: d1 Spring Fall p1 d2 p2 0.5 128 126 280 30 0 133 290 100 67 287.462687 year Growing season length (number of days) 180 169 159 159.462687 2016 2015 2014
Data Table 3 Data for Graph #11 Louise Levy BHS Red Maple - East vs West site date julian date 273 279 281 288 292 298 300 305 309 315 322 RM-2 West 0 0 0 0 0 3 8 12 12 RM-6 East 0 0 0 0 0 2 12 12 12 9/29/2016 10/5/2016 10/7/2016 10/14/2016 10/18/2016 10/24/2016 10/26/2016 10/31/2016 11/4/2016 11/10/2016 11/17/2016
Data Table 4 Data for Graph #12 Louise Levy BHS Red Oak - East vs West site date julian date 273 279 281 288 292 298 300 305 309 315 322 RO-1 West 0 0 1 1 1 1 5 5 5 5 12 RO-7 East 0 0 1 1 1 1 1 1 1 12 12 9/29/2016 10/5/2016 10/7/2016 10/14/2016 10/18/2016 10/24/2016 10/26/2016 10/31/2016 11/4/2016 11/10/2016 11/17/2016
Data Table 5 Data for Graph #13 Louise Levy BHS Grey Birch - East vs West site date julian date 273 279 281 288 292 298 300 305 309 315 322 GB-3 West 0 0 0 0 0 9 11 11 12 GB-8 East 0 0 0 0 0 5 7 8 12 9/29/2016 10/5/2016 10/7/2016 10/14/2016 10/18/2016 10/24/2016 10/26/2016 10/31/2016 11/4/2016 11/10/2016 11/17/2016
Data Table 6 Data for Graph #14 Elisa Margarita Site Code Teacher Date Julian Tree ID Species Code Total Leaves Fallen Leaves Tree Colorpercentage fallen BTH-buds-001 BTH-buds-001 BTH-buds-001 BTH-buds-001 BTH-buds-001 BTH-buds-001 BTH-buds-001 BTH-buds-001 BTH-buds-001 BTH-buds-001 BTH-buds-001 BTH-buds-001 BTH-buds-001 Margarita Margarita Margarita Margarita Margarita Margarita Margarita Margarita Margarita Margarita Margarita Margarita Margarita 9/28/2015 10/5/2015 10/13/2015 10/19/2015 10/27/2015 9/20/2016 9/26/2016 10/7/2016 10/14/2016 10/21/2016 10/28/2016 11/4/2016 11/10/2016 271 278 286 292 300 264 270 281 288 295 302 309 315 5 WK 5 WK 5 WK 5 WK 5 WK 5 WK 5 WK 5 WK 5 WK 5 WK 5 WK 5 WK 5 WK 12 12 12 12 12 24 24 24 24 24 24 24 24 0 2 3 6 8 0 0 3 4 4 1 1 2 2 4 1 1 1 1 1 1 1 1 0 17 25 50 67 0 0 13 17 17 46 58 58 11 14 14