Hands-on with Spectra in Geochemistry Lab
H
a
n
d
s
-
o
n
w
i
t
h
s
p
e
c
t
r
a
t
o
e
n
a
b
l
e
s
t
u
d
e
n
t
s
t
o
b
e
g
o
o
d
p
r
o
d
u
c
e
r
s
a
n
d
c
o
n
s
u
m
e
r
s
o
f
E
D
S
/
S
E
M
d
a
t
a
Dr. Michael Mengason
Research Geologist (Fellowship) - National Institute of Standards and Technology (NIST)
Adjunct Faculty – Northern Virginia Community College (NVCC)
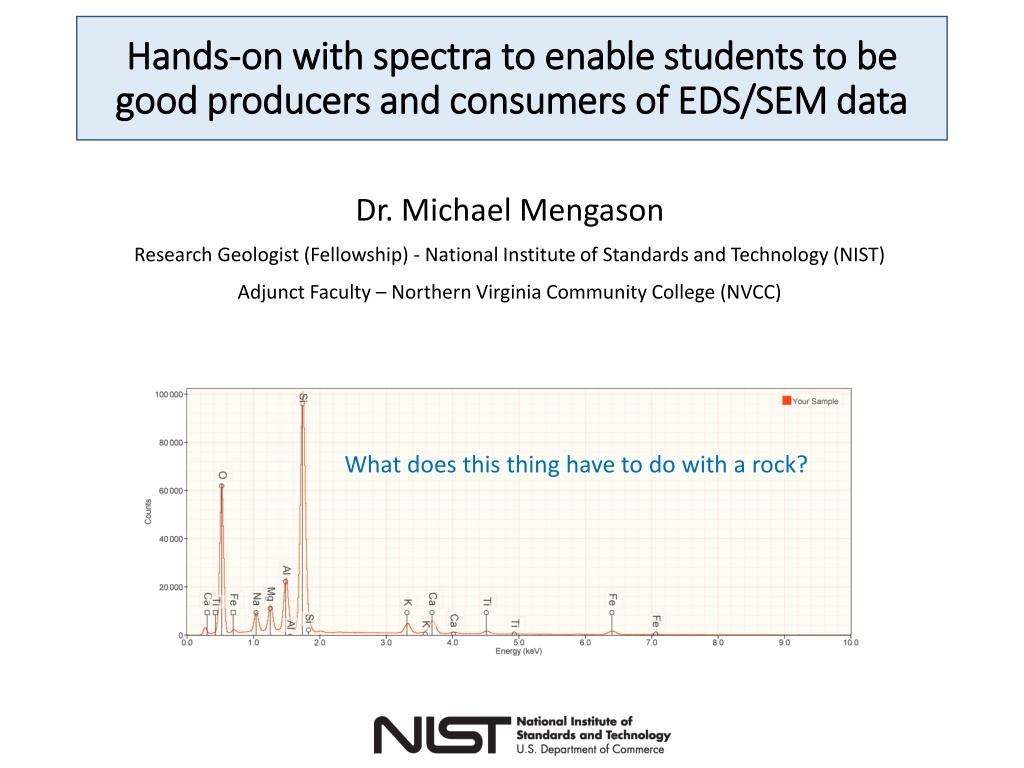
What does this thing have to do with a rock?
Scanning Electron Microscopes (SEM) are used widely in geoscience research and in
professional geoscience fields and are becoming more accessible to medium and small
colleges.
This lab is meant to give students an introduction to doing chemical analysis on an
SEM using Energy Dispersive Spectrometry (EDS) and to provide some information on
things to look out for when deciding whether data is sufficiently good to use.
Overall Topic
MonteCarlo simulations of
this process can be run on
software produced by NIST
called DTSA II.
The software allows students to ‘play’ with an EDS system and see what it would
look like to analyze samples and learn some simple basics of using EDS and
prepare them to be
producers
of EDS data in research projects and build career-
useful skills.
The software allows students to experiment with compositions and physical
shapes of samples to learn pitfalls and concerns and how to be critical
consumers
of EDS data.
- This is
not
a how-does-EDS work tutorial -
Real SEM/EDS
Simulation
Student-perspective questions this lab attempts to explore.
•
What will I actually be seeing when I analyze something.
What should I be looking at?
•
How do I read this thing? What
should
it look like?
•
What is the relationship between elements and peaks?
•
Should I be able to tell what is there just by ‘looking at it’?
•
What causes the software to make misidentifications and
which are common?
•
How does the type and preparation of the sample effect the
analysis?
•
Isn’t it a good thing that everything adds up to 100%?
Instructions given to the
student
Things the student would be
seeing
The software used can be downloaded free from: http://www.cstl.nist.gov/div837/837.02/epq/dtsa2/
Most EDS programs will have a few basic parts.
A place to display your
Spectrum (histogram)
A way to highlight
characteristic x-ray
lines (peaks)
associated with
elements
A way to choose 1
or more spectra to
display
A scale (how many x-rays of each energy were counted)
An energy scale
To begin, open the software and follow the instructions to perform your first
simulated analysis of SiO
2
.
(we will watch a video)
This is a video of
simulating Quartz, SiO
2
.
The student enters data
and allows the program
to simulate the effect of
electrons striking a flat,
polished piece of quartz.
The student then uses
the software to explore
the spectrum.
After some setup steps the student would jump in by performing a simulation of quartz,
SiO
2
.
Once the simulation is finished,
look at the spectrum. Your
spectrum should look something
like this.
Question
: How many peaks are
visible?
•
Find the part of the software in the red box
below. It allows you to add markers to your
spectrum. Most EDS software will have this. It is
one of the first things you should look for.
•
Click on the right-facing arrow to move through
the elements until you get to Oxygen (O).
•
Click on the check-box marked K-family.
•
Now click the right arrow though elements until
you get to Silicon (Si) and check the box for K-
family.
Question
:
The elements are in order of increase atomic
number (number of protons). What pattern can you
see in elements and the energy of their x-ray lines.
Note: click “clear all” to get rid of peak labels whenever you need to.
Question:
How many peaks are
visible?
Question:
The elements are in
order if increase atomic
number (number of
protons). What pattern
can you see in elements
and the energy of their
x-ray lines.
Repeat the simulation using MgO
as the material.
Question
: How many peaks are
visible?
Go through the elements using
the same tool as before and mark
the K-lines for Mg and O.
Now repeat the simulation using FeO as
the material.
Question
: How many peaks are visible?
Go through the elements using the
same tool as before and mark the K-
lines for Fe and O.
Question
:
The elements are in order if increase
atomic number (number of protons).
Consider your answer you gave to this
question before. What can you say
now about the elements and their x-ray
lines.
Student-produced spectrum MgO
Student-produced spectrum FeO
In the part of the software indicated
here
hold
down shift and select all 3 of your spectra. This
will allow you to see the 3 at the same time.
On the blank histogram below please sketch in
what you expect a spectrum of FeMgSiO
4
to
look like.
FeO + MgO + SiO
2
together would be
FeMgSiO
4
. Consider what you think that
mineral would look like.
Repeat the same type of
simulation using FeMgSiO
4
as the material. Select all 4
spectra and consider them.
Question:
How does the spectrum
you created compare to
your expectations?
1. There is less of each element.
Look at the lower right hand of
the program. It will show you
the composition that you
entered. There is less Mg in the
‘olivine’, so there a fewer Mg
atoms generating x-rays. The
same is true for Fe and Si. So
you get shorter peaks than the
other materials.
Student-produced spectrum FeMgSiO
4
and others
Olivine
MgO
What is going on?
New spectrum
2.
But also notice that the peaks for Si, Mg, and Fe are
not
the same height. In
the formula they are 1 Mg atom to 1 Fe atom to 1 Si atom. But the peaks are
different heights. What this tells us is that there is a lot of physics that
happens inside the part of the mineral being analyzed between electrons
coming in and x-rays escaping.
You cannot tell the
amount
(abundance)
of each element just by looking at the
spectrum.
Perform the same type of
simulation that you have
already done but this time
use the material MoS
2
(molybdenite).
Question:
How many
large
peaks do
you see?
As before, click up through
the elements and identify
any peaks.
Question:
Did you label the
molybdenum (Mo) K lines
or the L lines?
Question:
Explain what you think is
going on here? Why does
it look like this? (Hint, you
may want to change the
scale to 20 and then back
to 10)
Video of student interaction
For the next part, we want to look at what can effect the Quantitative results we can generate. That is,
the amount (quantity) of something in your mineral.
You are going to perform a simulation, but this time you are going to simulate a small olivine particle
sitting on a carbon plate. Follow the instructions to do so now.
The K, L, and M-lines of one element can appear in the same place in the energy spectrum as lines from another
element. This can lead to a
misidentification
by the software. This software did its best but some elements are just
easily confused. You must ask yourself if the elements the software suggests
make sense
. When the mistake is in
your
assignment, report, or paper it is
your
problem.
Here are some mistakes you may see with common rock-forming elements:
Question:
•
List the formula for 3 minerals you might want to analyze think about how it would look if the software had made
a mistake.
•
Model one of the minerals you just listed and see for yourself if the “look-alike” listed here makes sense.
Sodium (Na)
listed as Zinc (Zn)
Magnesium (Mg)
listed as Arsenic (As)
Aluminum (Al)
listed at Bromine (Br)
Silicon (Si)
listed as Tantalum (Ta)
Sulfur (S)
listed as Molybdenum (Mo) or Lead (Pb)
Chlorine (Cl)
listed as Rhodium (Rh)
Potassium (K)
listed as Indium (In)
Titanium (Ti)
listed as Barium (Ba)
Video simulation of rounded olivine grain on a carbon plate.
I
Your two spectra
may
look like
this, or slightly
different if you
chose different
materials or
particle size.
Notice that the Iron (Fe) peak is the same in both spectra. But the Magnesium (Mg) peak is larger
when you don’t have a ‘bulk’ sample.
The program will work with the data you give it. If you try and quantify this spectrum it will come
up with a value for Mg that is too high.
Experiment for a minute with a few different shapes and sizes of particles. But use the same
materials. Then compare them to the “bulk” spectra you produced.
Question:
Did any of your experiments give the same spectrum as Bulk? Were they always “wrong” in the
same way?
Fe
Si
Mg
O
I
The same experiments you just ran have also been done using real physical
samples in laboratories at NIST.
K411 is a glass with:
Mg = 8.85 % (mass)
Fe = 11.21 % (mass)
Bulk polished samples
give nearly correct
values
600-Grit
was flat but
not properly
polished.
Chips
and
Shards
where particles
like the ones you
created.
Question
:
What are the greatest and smallest % Fe they found?
What are the greatest and smallest % Mg they found?
If you are analyzing an unknown material, would you know you were wrong?
Newbury & Ritchie (2011)
I
The answer is yes.
If you add up the % of all the elements in the list you get the Analytical Total.
Most EDS
programs
“Normalize” the total so it always equals 100 %. But you can often ‘ask’ the
software to let you see the raw (not-normalize) total. Below you can see data from the same
set of experiments.
Questions:
•
What is the relationship between the Mg % and Raw Analytical Total?
•
Describe a way to use the Raw Analytical Total to predict when your values should not be
trusted.
Expected
value for
Mg
Thank you
If you are interested in using a lab similar to this in your class you are
welcome to contact me.
mmengason@gmail.com
And if you are interested in learning about doing quantitative standards-
based EDS using the DTSA II software you can contact me or the author of
the software: Dr. Nicholas Ritchie.
Nicholas.Ritchie@NIST.gov
Answer Space for Questions
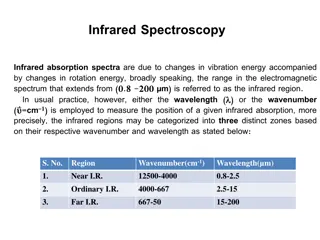
Scanning Electron Microscopes (SEM) are widely used in geoscience research. Explore how Energy Dispersive Spectrometry (EDS) enables students to become proficient producers and consumers of EDS/SEM data. The lab provides hands-on experience in chemical analysis using SEM and EDS, preparing students for research projects and building career-relevant skills. Gain insights into sample analysis, element identification, and software simulations. Student questions, instructions, and software resources are included to enhance learning in this field.

Download Presentation

Please find below an Image/Link to download the presentation.
The content on the website is provided AS IS for your information and personal use only. It may not be sold, licensed, or shared on other websites without obtaining consent from the author.If you encounter any issues during the download, it is possible that the publisher has removed the file from their server.
You are allowed to download the files provided on this website for personal or commercial use, subject to the condition that they are used lawfully. All files are the property of their respective owners.
The content on the website is provided AS IS for your information and personal use only. It may not be sold, licensed, or shared on other websites without obtaining consent from the author.
E N D
Presentation Transcript
Hands Hands- -on with spectra to enable students to be on with spectra to enable students to be good producers and consumers of EDS/SEM data good producers and consumers of EDS/SEM data Dr. Michael Mengason Research Geologist (Fellowship) - National Institute of Standards and Technology (NIST) Adjunct Faculty Northern Virginia Community College (NVCC) What does this thing have to do with a rock?
Overall Topic Scanning Electron Microscopes (SEM) are used widely in geoscience research and in professional geoscience fields and are becoming more accessible to medium and small colleges. This lab is meant to give students an introduction to doing chemical analysis on an SEM using Energy Dispersive Spectrometry (EDS) and to provide some information on things to look out for when deciding whether data is sufficiently good to use.
Real SEM/EDS Simulation X-rays Electron Beam MonteCarlo simulations of this process can be run on software produced by NIST called DTSA II. sample Side View The software allows students to play with an EDS system and see what it would look like to analyze samples and learn some simple basics of using EDS and prepare them to be producers of EDS data in research projects and build career- useful skills. The software allows students to experiment with compositions and physical shapes of samples to learn pitfalls and concerns and how to be critical consumers of EDS data. - This is not a how-does-EDS work tutorial -
Student-perspective questions this lab attempts to explore. What will I actually be seeing when I analyze something. What should I be looking at? How do I read this thing? What should it look like? What is the relationship between elements and peaks? Should I be able to tell what is there just by looking at it ? What causes the software to make misidentifications and which are common? How does the type and preparation of the sample effect the analysis? Isn t it a good thing that everything adds up to 100%? Things the student would be seeing Instructions given to the student The software used can be downloaded free from: http://www.cstl.nist.gov/div837/837.02/epq/dtsa2/
Most EDS programs will have a few basic parts. A scale (how many x-rays of each energy were counted) A place to display your Spectrum (histogram) An energy scale A way to highlight characteristic x-ray lines (peaks) associated with elements A way to choose 1 or more spectra to display To begin, open the software and follow the instructions to perform your first simulated analysis of SiO2. (we will watch a video)
After some setup steps the student would jump in by performing a simulation of quartz, SiO2. This is a video of simulating Quartz, SiO2. The student enters data and allows the program to simulate the effect of electrons striking a flat, polished piece of quartz. The student then uses the software to explore the spectrum.
Once the simulation is finished, look at the spectrum. Your spectrum should look something like this. Question: How many peaks are visible? Find the part of the software in the red box below. It allows you to add markers to your spectrum. Most EDS software will have this. It is one of the first things you should look for. Click on the right-facing arrow to move through the elements until you get to Oxygen (O). Click on the check-box marked K-family. Now click the right arrow though elements until you get to Silicon (Si) and check the box for K- family. Question: The elements are in order of increase atomic number (number of protons). What pattern can you see in elements and the energy of their x-ray lines. Note: click clear all to get rid of peak labels whenever you need to.
Question: How many peaks are visible? Question: The elements are in order if increase atomic number (number of protons). What pattern can you see in elements and the energy of their x-ray lines.
Repeat the simulation using MgO as the material. Student-produced spectrum MgO Question: How many peaks are visible? Go through the elements using the same tool as before and mark the K-lines for Mg and O. Now repeat the simulation using FeO as the material. Student-produced spectrum FeO Question: How many peaks are visible? Go through the elements using the same tool as before and mark the K- lines for Fe and O. Question: The elements are in order if increase atomic number (number of protons). Consider your answer you gave to this question before. What can you say now about the elements and their x-ray lines.
In the part of the software indicated here hold down shift and select all 3 of your spectra. This will allow you to see the 3 at the same time. FeO + MgO + SiO2 together would be FeMgSiO4. Consider what you think that mineral would look like. On the blank histogram below please sketch in what you expect a spectrum of FeMgSiO4 to look like.
Student-produced spectrum FeMgSiO4 and others Repeat the same type of simulation using FeMgSiO4 as the material. Select all 4 spectra and consider them. Question: How does the spectrum you created compare to your expectations? New spectrum What is going on? MgO 1. There is less of each element. Look at the lower right hand of the program. It will show you the composition that you entered. There is less Mg in the olivine , so there a fewer Mg atoms generating x-rays. The same is true for Fe and Si. So you get shorter peaks than the other materials. Olivine
2. But also notice that the peaks for Si, Mg, and Fe are not the same height. In the formula they are 1 Mg atom to 1 Fe atom to 1 Si atom. But the peaks are different heights. What this tells us is that there is a lot of physics that happens inside the part of the mineral being analyzed between electrons coming in and x-rays escaping. You cannot tell the amount(abundance) of each element just by looking at the spectrum.
Perform the same type of simulation that you have already done but this time use the material MoS2 (molybdenite). Video of student interaction Question: How many large peaks do you see? As before, click up through the elements and identify any peaks. Question: Did you label the molybdenum (Mo) K lines or the L lines? Question: Explain what you think is going on here? Why does it look like this? (Hint, you may want to change the scale to 20 and then back to 10)
The K, L, and M-lines of one element can appear in the same place in the energy spectrum as lines from another element. This can lead to a misidentification by the software. This software did its best but some elements are just easily confused. You must ask yourself if the elements the software suggests make sense. When the mistake is in your assignment, report, or paper it is your problem. Here are some mistakes you may see with common rock-forming elements: Sodium (Na) listed as Zinc (Zn) Magnesium (Mg) listed as Arsenic (As) Aluminum (Al) listed at Bromine (Br) Silicon (Si) listed as Tantalum (Ta) Sulfur (S) listed as Molybdenum (Mo) or Lead (Pb) Chlorine (Cl) listed as Rhodium (Rh) Potassium (K) listed as Indium (In) Titanium (Ti) listed as Barium (Ba) Question: List the formula for 3 minerals you might want to analyze think about how it would look if the software had made a mistake. Model one of the minerals you just listed and see for yourself if the look-alike listed here makes sense. For the next part, we want to look at what can effect the Quantitative results we can generate. That is, the amount (quantity) of something in your mineral. You are going to perform a simulation, but this time you are going to simulate a small olivine particle sitting on a carbon plate. Follow the instructions to do so now.
Video simulation of rounded olivine grain on a carbon plate.
Your two spectra may look like this, or slightly different if you chose different materials or particle size. O Mg Si Fe I Notice that the Iron (Fe) peak is the same in both spectra. But the Magnesium (Mg) peak is larger when you don t have a bulk sample. The program will work with the data you give it. If you try and quantify this spectrum it will come up with a value for Mg that is too high. Experiment for a minute with a few different shapes and sizes of particles. But use the same materials. Then compare them to the bulk spectra you produced. Question: Did any of your experiments give the same spectrum as Bulk? Were they always wrong in the same way?
The same experiments you just ran have also been done using real physical samples in laboratories at NIST. K411 is a glass with: Mg = 8.85 % (mass) Fe = 11.21 % (mass) Bulk polished samples give nearly correct values 600-Grit was flat but not properly polished. I Chips and Shards where particles like the ones you created. Newbury & Ritchie (2011) Question: What are the greatest and smallest % Fe they found? What are the greatest and smallest % Mg they found? If you are analyzing an unknown material, would you know you were wrong?
The answer is yes. If you add up the % of all the elements in the list you get the Analytical Total. Most EDS programs Normalize the total so it always equals 100 %. But you can often ask the software to let you see the raw (not-normalize) total. Below you can see data from the same set of experiments. Questions: What is the relationship between the Mg % and Raw Analytical Total? Describe a way to use the Raw Analytical Total to predict when your values should not be trusted. Expected value for Mg I
Thank you If you are interested in using a lab similar to this in your class you are welcome to contact me. mmengason@gmail.com And if you are interested in learning about doing quantitative standards- based EDS using the DTSA II software you can contact me or the author of the software: Dr. Nicholas Ritchie. Nicholas.Ritchie@NIST.gov