Exploring the World of Spectroscopy and the Electromagnetic Spectrum
Spectroscopy is a crucial tool for astronomers to analyze the composition of objects in space by separating light into its constituent colors. Each chemical element has a unique spectral fingerprint that helps in identification. The Electromagnetic Spectrum provides a comprehensive view of different wavelengths, from radio waves to gamma rays. Understanding types of spectra, like continuous and bright line spectra, further enhances our knowledge of light properties and element identification in the universe.
Download Presentation

Please find below an Image/Link to download the presentation.
The content on the website is provided AS IS for your information and personal use only. It may not be sold, licensed, or shared on other websites without obtaining consent from the author.If you encounter any issues during the download, it is possible that the publisher has removed the file from their server.
You are allowed to download the files provided on this website for personal or commercial use, subject to the condition that they are used lawfully. All files are the property of their respective owners.
The content on the website is provided AS IS for your information and personal use only. It may not be sold, licensed, or shared on other websites without obtaining consent from the author.
E N D
Presentation Transcript
What is it? A spectroscope is a tool used by astronomers to separate light into its rainbow of colors in the spectrum. This techniqueused to help scientists determine the composition of objects made up of hot incandescent gases (like stars) and cool gases (like planetary atmospheres). Spectrometers are used to analyze the amounts and types of spectral light that comes from objects in space.
Spectroscopes break down the light emitted or absorbed by chemical elements into specific lines of color. Every chemical element has a "fingerprint" of its own that can be used to identify it. These fingerprints are generally produced when electrons change orbital levels as they gain or lose energy. That s cool Different energies produce different colored lines.
Star Fingerprints Every chemical element on the periodic table has its own spectral fingerprintthat identifies it. (this is important) When looking at spectra from objects like stars and planetary atmospheres, it is easy to identify the chemical elements present by matching the colored spectral lines with the elements spectral fingerprint. See Spectra of gas discharge
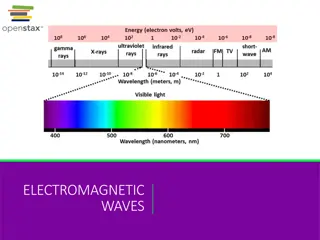
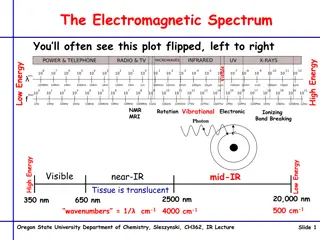
http://upload.wikimedia.org/wikipedia/commons/thumb/8/8a/Electromagnetic-Spectrum.png/300px-Electromagnetic-Spectrum.pnghttp://upload.wikimedia.org/wikipedia/commons/thumb/8/8a/Electromagnetic-Spectrum.png/300px-Electromagnetic-Spectrum.png Wavelengths Look at the chart on the right notice the different areas of the scale for each wavelength. Where do you find: Radio waves? Microwaves? Infrared Visible light Ultraviolet X-rays Gamma rays
What is the Electromagnetic Spectrum?
Types of Spectra Continuous spectrum unbroken rainbow of color. What order do the colors go in? File:Linear visible spectrum.svg
Bright line spectrum Un evenly spaced lines of different colors which are unique to each element. File:Spectral lines emission.png
Different types of spectrum analysis
Element discharge samples http://jersey.uoregon.edu/elements/Elements .html
Spectroscope lab Let s see how it works with some samples of isolated gases
What is the doppler effect? A change in wavelength of light or sound from moving objects ie: a train passing What happens as the train is moving closer? Moving away? Doppler effect animations
Doppler shift With stars in a spectrum there is also doppler effect. We can see it through the spectroscope signatures, and notice whether there is a red or blue shift
Red Shift or Blue ? http://upload.wikimedia.org/wikipedia/commons/thumb/1/14/Redshift.png/200px-Redshift.png In red shift- stars are moving away from Earth, so the visible spectrum shifts more toward the red end, Blue Shift stars are moving closer toward the earth
