Grant Educational Outcomes and Practice Changes Report
This report showcases the educational outcomes, HCP insights, top educational gaps, and practice changes and barriers related to a specific grant program. It includes details on faculty, learning objectives, learner breakdown, educational gaps, knowledge and competence changes, potential patient impacts, and more.
Download Presentation

Please find below an Image/Link to download the presentation.
The content on the website is provided AS IS for your information and personal use only. It may not be sold, licensed, or shared on other websites without obtaining consent from the author.If you encounter any issues during the download, it is possible that the publisher has removed the file from their server.
You are allowed to download the files provided on this website for personal or commercial use, subject to the condition that they are used lawfully. All files are the property of their respective owners.
The content on the website is provided AS IS for your information and personal use only. It may not be sold, licensed, or shared on other websites without obtaining consent from the author.
E N D
Presentation Transcript
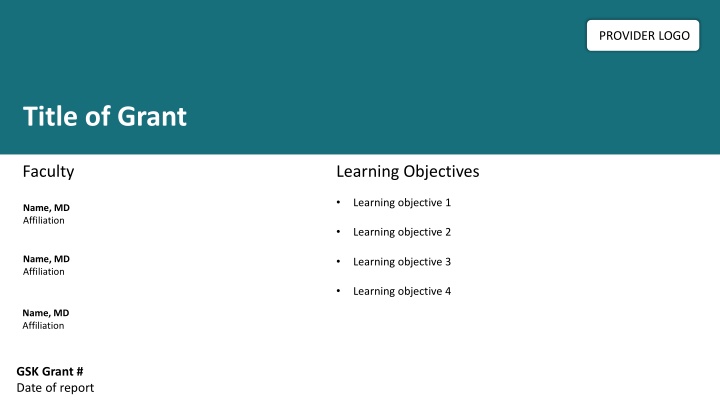
PROVIDER LOGO Title of Grant Faculty Learning Objectives Learning objective 1 Name, MD Affiliation Learning objective 2 Name, MD Affiliation Learning objective 3 Learning objective 4 Name, MD Affiliation GSK Grant # Date of report
Educational Outcomes Summary PROVIDER LOGO HCP Insights Gained for Future Education HCP Learner Breakdown Learners Specialty 1 Specialty 2 Specialty 3 Specialty 4 Specialty 5 Specialty 6 Not specified Other 10% 10% Physicians Physician Assistants Pharmacists Nurse Practitioners Nurses Industry Not specifiedN= 17% 25% 27% Insight 1 30% 10% Setting 1 Setting 2 Setting 3 Other 1 XX Practice Setting Professional Designation Specialty 30% 10% 4% 3% 15% 15% 44% 2% 30% N= 15% N= 2% Insight 2 2 Top Educational Gaps N= 30% Educational gap 1 N= 84% Insight 3 3 N= 80% Educational gap 2 N= 84% N= 56% Educational gap 3 Insight 4 N= 89% 4 Educational gap 4 N= 42% 87% N= Learning Objectives Met Knowledge/Competence & Performance/Practice Changes XX% Knowledge/ Competence Potential Patient Impact of Supported Education Month=XX XX% Performance/ Practice Agreed or strongly agreed N= XX% XX Patients per XX HCPs Potential Patients Impacted per Month
Top Educational Gaps PROVIDER LOGO Educational gap 1 Educational gap 2 46% 50% 80% 50%62% 36% 35% 34% 40% 60% 22%13% 20% 17% 30% 21% 8% 7% 40% 20% 14% 9% 20% 5% 10% 0% 0% Answer 1 Answer 2 Answer 3 Answer 4 Answer 1 Answer 2 Answer 3 Answer 4 N= N= Pre % Post % Pre % Post % Educational gap 3 Educational gap 4 40% 40% 31% 31% 28% 28% 25% 25% 30% 30% 22%16% 22%16% 16%20% 16%20% 19% 19% 15% 15% 20% 20% 8% 8% 10% 10% 0% 0% Answer 1 Answer 2 Answer 3 Answer 4 Answer 5 Answer 1 Answer 2 Answer 3 Answer 4 Answer 5 N= Pre % Post % Pre % Post % N= = Correct answer
Practice Changes & Barriers PROVIDER LOGO Performance/Practice Changes Barriers to Change Overall average % of HCPs reporting practice or behavior change XX% Overall average % of HCPs reporting barrier to practice or behavior change XX% N= N= Responses (%) Responses (%) N= 4,268 N= 2,495 Change 1 21% 38% Barrier 1 N= 2,379 20% Barrier 2 N= 2,251 Change 2 20% Barrier 3 N= 2,220 19% Change 3 N= 1,526 14% N= 2,188 Barrier 4 19% N= 1,490 13% Change 4 Barrier 5 N= 1,791 15% Change 5 3% N= 379 Barrier 6 N= 295 3% N= 252 2% Other N= 10,166 N= 11,564 N= 196 Other 2% Learners reporting a specific change Learners reporting a specific barrier
Questions & Insights PROVIDER LOGO HCP Questions Question 6 Question 1 6 1 Question 2 Question 7 7 2 List Faculty Insights Question 8 Question 3 8 3 Question 4 Question 9 4 9 Question 5 Question 10 5 10 Faculty Insights Insight 1 Insight 2 Insight 3 Name, MD Affiliation Name, MD Affiliation Name, MD Affiliation
Add the Educational Provider logo here. PROVIDER LOGO Title of Grant Enter the Title here. Enter up to 4 Learning Objectives in the spaces provided. Faculty Learning Objectives Learning Objective 1 Name, MD Affiliation Learning Objective 2 Enter the Faculty Names and Affiliations here. Learning Objective 3 Name, MD Affiliation Learning Objective 4 Name, MD Affiliation Enter the Grant # and Date of the Report. GSK Grant # Date of report
Double click to select the chart, then right click and choose "Edit Data in Excel." In the excel sheet, please edit the % of HCP Learners by their Professional Designation. Educational Outcomes Summary choose "Edit Data in Excel." In the excel sheet, please edit the % of HCP Learners by their Specialty. Double click to select the chart, then right click and choose "Edit Data in Excel." In the excel sheet, please edit the % of HCP Learners by their Practice Setting. Add the Educational Provider logo here. Double click to select the chart, then right click and PROVIDER LOGO HCP Insights Gained for Future Education HCP Learner Breakdown Learners Specialty 1 Specialty 2 Specialty 3 Specialty 4 Specialty 5 Specialty 6 Not specified Other 10% 10% Physicians Physician Assistants Pharmacists Nurse Practitioners Nurses Industry Not specifiedN= 17% 25% Enter the Top 4 Insights Gained For Future Education in the spaces provided. 27% Insight 1 30% 10% Setting 1 Setting 2 Setting 3 Other 1 XX Practice Setting Professional Designation Specialty 30% 10% 4% 3% 15% 15% 44% 2% 30% N= 15% N= 2% Enter the total HCP Learners here. Add the N here. Insight 2 2 Add the N here. Top Educational Gaps Add the N here. Double click to select the chart, then right click and choose "Edit Data in Excel." In the excel sheet, please enter the Pre-test/Post-test percent correct. N= 30% Educational gap 1 N= 84% Insight 3 3 N= 80% Educational gap 2 N= Enter the Top 4 Educational Gaps in the spaces provided. 84% Add the Ns here. N= 56% Educational gap 3 Insight 4 N= Enter the % of HCP Learners who agreed or strongly agreed the learning objectives were achieved. Double click to select the chart, then right click and choose "Edit Data in Excel." In the excel sheet, please edit the % agreed or 89% 4 Educational gap 4 N= 42% Enter the number of HCPs, Patients per Month, and Potential Patients Impacted per Month here. 87% N= Enter the % of change in Practice/Performance here. Enter the % of change in Knowledge/Competence here. Learning Objectives Met strongly agreed learning objectives Knowledge/Competence & Performance/Practice Changes XX% Knowledge/ Competence Potential Patient Impact of Supported Education Month=XX were met. XX% Performance/ Practice Agreed or strongly agreed N= XX% XX Patients per XX HCPs Add the N here. Potential Patients Impacted per Month
Top Educational Gaps Add the Educational Provider logo here. PROVIDER LOGO Enter the Top 4 Educational Gaps in the spaces provided. Educational gap 1 Educational gap 2 Double click to select the chart, then right click and choose "Edit Data in Excel." In the excel sheet, please enter the answer choices and the Pre-test/Post-test percent correct. 46% 50% 80% 50%62% 36% 35% 34% 40% 60% 22%13% 20% 17% 30% 21% 8% 7% 40% 20% 14% 9% 20% 5% 10% 0% 0% Answer 1 Answer 2 Answer 3 Answer 4 Answer 1 Answer 2 Answer 3 Answer 4 If applicable, add a star to indicate the correct response(s). N= N= Pre % Post % Pre % Post % Educational gap 3 Educational gap 4 Add the Ns here. 40% 40% 31% 31% 28% 28% 25% 25% 30% 30% 22%16% 22%16% 16%20% 16%20% 19% 19% 15% 15% 20% 20% 8% 8% 10% 10% 0% 0% Answer 1 Answer 2 Answer 3 Answer 4 Answer 5 Answer 1 Answer 2 Answer 3 Answer 4 Answer 5 N= Pre % Post % Pre % Post % N= = Correct answer
Practice Changes & Barriers Add the Educational Provider logo here. PROVIDER LOGO Performance/Practice Changes Barriers to Change Overall average % of HCPs reporting practice or behavior change XX% Overall average % of HCPs reporting barrier to practice or behavior change XX% Add the N here. Add the N here. N= N= Enter overall average % of HCPs reporting a practice or behavior change here. Enter overall average % of HCPs reporting a barrier to practice or behavior change here. Responses (%) Responses (%) Double click to select the chart, then right click and choose "Edit Data in Excel." In the excel sheet, please enter the % for each specific practice or behavior change reported by learners. Double click to select the chart, then right click and choose "Edit Data in Excel." In the excel sheet, please enter the % for each specific barrier to practice or behavior change reported by N= 4,268 N= 2,495 Change 1 21% 38% Barrier 1 N= 2,379 learners. 20% Barrier 2 N= 2,251 Change 2 20% Barrier 3 N= 2,220 19% Change 3 N= 1,526 14% N= 2,188 Barrier 4 19% N= 1,490 13% Change 4 Barrier 5 N= 1,791 15% Change 5 3% N= 379 Barrier 6 N= 295 3% Add the N here. Add the N here. N= ? 2% Other N= 10,166 N= 11,564 N= ? Other 2% Learners reporting a specific change Learners reporting a specific barrier
Questions & Insights Add the Educational Provider logo here. PROVIDER LOGO Enter up to 10 HCP Questions in the spaces provided. HCP Questions Question 6 Question 1 6 1 Question 2 Question 7 7 2 List Faculty Insights Question 8 Question 3 8 3 Question 4 Question 9 4 9 Question 5 Question 10 5 10 Enter up to 3 Faculty Insights in the spaces provided. Faculty Insights Add Faculty headshot here. Insight 1 Insight 2 Insight 3 Name, MD Affiliation Name, MD Affiliation Name, MD Affiliation Enter the Faculty Name and Affiliation here.
