Global Cotton Outlook and Trends for 2020/21
The USDA's report on the global cotton outlook for 2020/21 highlights a rebound in consumption, with China leading the way. World production is projected to fall due to lower prices, while China is expected to increase imports. Global stocks are predicted to reach a four-year low, resulting in slightly higher world prices. Despite challenges such as declining consumption and trade disputes, the cotton market remains dynamic and responsive to various factors affecting supply and demand.
Download Presentation

Please find below an Image/Link to download the presentation.
The content on the website is provided AS IS for your information and personal use only. It may not be sold, licensed, or shared on other websites without obtaining consent from the author.If you encounter any issues during the download, it is possible that the publisher has removed the file from their server.
You are allowed to download the files provided on this website for personal or commercial use, subject to the condition that they are used lawfully. All files are the property of their respective owners.
The content on the website is provided AS IS for your information and personal use only. It may not be sold, licensed, or shared on other websites without obtaining consent from the author.
E N D
Presentation Transcript
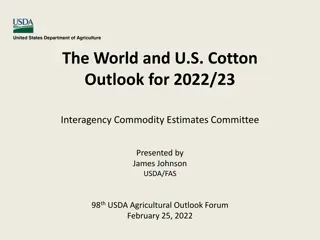
The World and U.S. Cotton Outlook for 2020/21 Interagency Commodity Estimates Committee Presented by Graham Soley graham.soley@usda.gov Agricultural Outlook Forum February 21, 2020
USDA Global Cotton Outlook Highlights 2019/20 Review: World consumption slows (again) Production higher, largest area harvested in 8 years Trade expands aided by domestic shortfalls, Brazil, and China China s reserve stocks remain at government s preferred level A-Index dips to the mid-70-cent range. 2
USDA Global Cotton Outlook Highlights 2020/21 Outlook: Global consumption rebounds (1.7%), led by China World production falls, lower relative prices China expected to increase imports (10 Mill) Global Stocks fall to 4-Year low World prices up slightly 3
World Cotton Prices Fall for 2ndConsecutive Year Cents/lb. Million bales Production Consumption A Index 140 120 with global consumption also declining 130 110 120 100 110 90 100 80 74 90 70 80 60 70 50 2014/15 2015/16 2016/17 Marketing year 2017/18 2018/19 2019/20 est. Sources: USDA, Interagency Commodity Estimates Committee and Cotlook. 5
Global Cotton Production Changes in 2019/20: Highest area harvested in 8 years! Million bale change 4.0 3.7 3.0 U.S. s largest area harvested in 13 YEARS 1.7 2.0 Australia s lowest area harvested since 1978 1.0 0.4 0.0 -0.3 -0.3 -0.5 -1.0 -1.0 -1.5 -2.0 AustraliaPakistan China Turkey Brazil Franc Zone U.S. India Source: USDA, Interagency Commodity Estimates Committee. 6
Cotton Consumption Declines for 2nd Consecutive Year Cotton consumption estimated at 119.0 million bales. Marginal (1%) drop 3-year low Led by reductions in China, Vietnam, and Indonesia Prior trade dispute and U.S. tariffs on Chinese apparel COVID-19 7
Cotton Consumption Declines for 2nd Consecutive Year Cotton consumption estimated at 119.0 million bales. Lower Global GDP Growth Forecasts (IMF) Weakest growth since financial crisis Despite this, half of top 10 consuming countries projected up 8
Cotton/Polyester Price Ratio 2.2 2.0 Fiber price ratio 1.8 1.6 1.4 1.2 1.0 0.8 0.6 2005 2010 2015 2020 A Index/polyester Linear (A Index/polyester) Source: USDA calculations based on data from Cotlook Ltd., Cncotton, National Cotton Council, and International Cotton Advisory Committee. 9
China Consumption At 4-Year Low Million bales 42 41 40 39 38 37 41.0 39.5 36 38.5 37.5 35 36.0 34 33 2015/16 2016/17 2017/18 2018/19 2019/20 est. Marketing year Source: USDA 10
Global Cotton Stocks Up Y-O-Y Stocks (Less China) Rise for 4th Consecutive Year 120 China ROW U.S. 100 RECORD stocks (outside of China) 80 Million bales 60 40 20 Exceeds previous record by 4 million 0 2014/15 2015/16 2016/17 2017/18 2018/19 2019/20 est. Source: USDA, Interagency Commodity Estimates Committee. 11
China Ending Stocks At 8-Year Low Mil. Bales % 70 200 60 150 50 40 100 30 20 50 25.2 23.2 21.7 10 16.4 15.0 12.8 0 0 2014/15 2015/16 2016/17 2017/18 2018/19 2019/20 est. Other Stocks State Reserve Stocks-to-use Sources: USDA 12
U.S. Cotton Supply & Demand Estimates: Production, Exports, and Stocks Trend Higher Unit 2018/19 2019/20 Change (%) Beg. stocks Mil. bales 4.2 4.9 15.5 Production Imports " " 18.4 0.0 20.1 0.0 9.4 0.0 Total supply Mill use " " 22.6 3.0 25.0 3.0 10.6 0.7 Exports " 14.8 16.5 11.8 Total demand Ending stocks " " 17.7 4.9 19.5 5.4 9.9 11.3 Stocks-to-use Upland farm price % 27.3 70.3 27.7 62.0 1.5 Cents/lb. -11.8 Source: USDA, Interagency Commodity Estimates Committee. 15
Top U.S. Cotton Export Shares 2019/20 (As of Feb. 6 ) 2018/19 24% 23% 36% 38% 11% 11% 9% 10% 9% 6% 10% 13% Vietnam China Turkey Pakistan India ROW Source: U.S. Export Sales 16
USDAs 2020/21 Outlook Continuation of current policy Signing of Phase One Agreement World economic growth more favorable (3.3% vs 2.9%) Caveat of Jan. IMF Forecast Global consumption rebounds, led by China Higher China imports(State Reserve s role) Relatively lower cotton prices lowers production World and U.S. cotton prices up slightly 18
Higher World Cotton Consumption Forecast for 2020/21 Global consumption projected at 121.0 M bales 4th highest on record with modest growth (1.7%) Global GDP growth China s consumption growth at nearly 3% Recovery from trade dispute and coronavirus First y-o-y growth in 3 years 19
Higher World Cotton Consumption Forecast for 2020/21 Consumption outside China: India, Turkey, and Pakistan expand use (once again) Growth in Vietnam and Bangladesh Cotton s projected share of world fiber market slightly lower 20
Global Production Projected Lower in 2020/21: Area declines in major producing countries Million bale change 1.5 Brazil, India, and U.S. decrease plantings 1 0.5 0 -0.5 Australia and Pakistan recover from abnormal production levels -1 -1.5 Brazil India U.S. Fr. Zone China Turkey Pakistan Australia Source: USDA, Interagency Commodity Estimates Committee. 21
World Cotton Supply & Demand Projections: Consumption Exceeds Production, Stocks Fall Unit 2019/20 2020/21 Change (%) 80.0 82.1 2.7 Beg. stocks Mil. bales 34.5 33.1 -4.0 Area Harvested Mil. HA 121.3 118.5 -2.3 Production Mil. bales 43.5 44.5 2.2 Imports " 201.3 200.6 -0.3 Total supply " 43.5 44.5 2.2 Exports " 119.0 121.0 1.7 Use " 119.2 121.2 1.7 Total Use " 82.1 79.4 -3.3 Ending stocks " 48.6 47.5 -2.2 Outside of China 69.0 65.6 -4.9 Stocks-to-use % Source: USDA, Interagency Commodity Estimates Committee. 22
Global Cotton Stocks Projected Slightly Lower and world prices edge up Million bales Cents/lb. Rest of World China A Index 100 100 90 80 90 70 79.0 60 80 50 40 70 30 20 60 10 0 50 2015/16 2016/17 2017/18 2018/19 2019/20 est. 2020/21 proj Marketing year Source: USDA, Interagency Commodity Estimates Committee. 23
Chinas State Cotton Reserves: SR stocks continue at government s preferred level Million bales 60 50 40 30 20 10 10.5 0 2013/14 2014/15 2015/16 2016/17 2017/18 2018/19 2019/20 est. 2020/21 proj. Source: USDA, Interagency Commodity Estimates Committee. 24
Outlook for 2020/21 U.S. Cotton Area Planted acreage expected slightly lower. Total plantings at 12.5 M acres 9% decrease. NCC survey indicated 13.0 M acres. Relative prices are somewhat unfavorable as of early February. Soybeans marginally higher Y-O-Y Corn marginally higher Y-O-Y 26
U.S. Cotton Planted Area: A Historical Perspective Million acres 18 1965-2019 average 15 12 9 Area in 2020 equal to the average! 6 3 1965 1970 1975 1980 1985 1990 1995 2000 2005 2010 2015 2020 Marketing year Source: USDA, National Agricultural Statistics Service. 27
U.S. Cotton Area, Yield, and Production Key Factor Includes Adequate Soil Moisture Southwest expected to account for 60% of planted area Unit 2019/20 2020/21 Change(%) Planted area Mil. acres 13.74 12.50 -9.0 Harvested area " 11.80 10.95 -7.2 Abandonment rate % 14.1 12.4 -12.1 Yield/harvested acre Lbs. 817 855 4.7 Production Mil. bales 20.10 19.50 -3.0 Source: USDA, Interagency Commodity Estimates Committee. 29
Steady U.S. Export Forecast: Contingent Upon Global Economic Growth China Brazil Vietnam 30
U.S. Cotton Supply & Demand Projections: Production and Stocks Fall; Exports Unchanged Unit 2019/20 2020/21 Change (%) 4.9 20.1 5.4 19.5 11.3 -3.0 Beg. stocks Mil. bales Production Imports " " 0.0 0.0 0.0 25.0 3.0 24.9 3.0 -0.2 0.0 Total supply Mill use " " 16.5 19.5 16.5 19.5 0.0 0.0 Exports " Total demand Ending stocks " " 5.4 5.3 -1.9 27.7 27.2 -1.8 Stocks-to-use Upland Farm price % Cents/lb. 62.0 64.0 3.2 Source: USDA, Interagency Commodity Estimates Committee. 31
Global WILDCARDS Production Shocks China and COVID-19 India MSP Program Vietnam and Bangladesh Polyester, Viscose, and other MMFs 32
Presented by Graham Soley USDA/FAS graham.soley@usda.gov 202-772-4235 33
