Genetic Analysis Summary Report
This report presents a detailed analysis of pass, fail, and borderline statuses across various genetic testing parameters. It includes information on chromatin fragmentation, library size, sequencing statistics, motif identification, and more. The report provides insight into the accuracy and completeness of sample information, as well as recommendations for further analysis and improvement.
Download Presentation

Please find below an Image/Link to download the presentation.
The content on the website is provided AS IS for your information and personal use only. It may not be sold, licensed, or shared on other websites without obtaining consent from the author.If you encounter any issues during the download, it is possible that the publisher has removed the file from their server.
You are allowed to download the files provided on this website for personal or commercial use, subject to the condition that they are used lawfully. All files are the property of their respective owners.
The content on the website is provided AS IS for your information and personal use only. It may not be sold, licensed, or shared on other websites without obtaining consent from the author.
E N D
Presentation Transcript
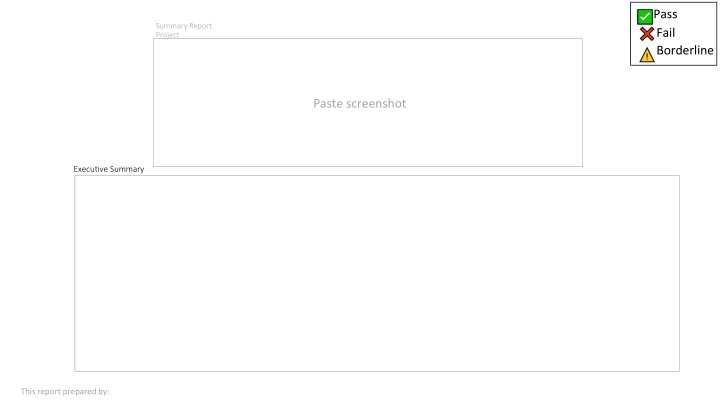
Pass Fail Borderline Summary Report Project Paste screenshot Executive Summary This report prepared by:
Pass Fail Borderline Status Sample descriptions Sample information accurate and complete Comments: Enter comments Paste screenshot
Pass Fail Borderline Chromatin fragmentation check Status Smear predominantly between 200-500 bp Comments: Enter comments Paste screenshot; rotate right by 90 May need crop and align lane assignments Copy/paste and align vertical yellow lines on top of gel
Library size check Pass Fail Borderline Status Smear predominantly between 150-500 bp Comments: Enter comments Paste screenshot; rotate right by 90 May need crop and align lane assignments Copy/paste and align vertical yellow lines on top of gel Average Insert size (PE) Paste screenshot
Sequencing statistics Pass Fail Borderline Status Status >requested >50% Complexity Sample Id Genome Total read Count Deduplicated % Comments: Enter comments Paste & align screenshot Paste & align screenshot Paste & align screenshot Paste & align screenshot
Pass Fail Borderline Sample# technical + + control Sample# technical control Status Status Expected Expected Motif 1 Moitif 1 Target: CTCF Target: IgG Composite plot Composite plot MEME motif MEME motif Comments: Enter comments Comments: Enter comments
Pass Fail Borderline Sample# Sample# + + control Sample# Sample# control Status Status Expected Expected Motif 1 Moitif 1 Target: Target: Composite plot Composite plot MEME motif MEME motif Comments: Enter comments Comments: Enter comments
Pass Fail Borderline PEGR Archived example 1 PEGR Archived example 2 Status Status Expected Expected Motif 1 Moitif 1 Target: Target: Composite plot Composite plot MEME motif MEME motif Comments: Enter comments Comments: Enter comments
Pass Fail Borderline Assay example ##### Assay example ##### Status Status Expected Expected Motif 1 Moitif 1 Target: Target: Composite plot Composite plot 5 bp periodicity MEME motif MEME motif Comments: Enter comments Comments: Enter comments
Datafiles & Analysis We provide the raw FastQ files, raw BAMs, filtered BAMs from the sequencing results to you together with a copy of this summary report. The files are available in a shared Cornell Box folder for 30 days. A link will be sent to you. We keep the metainformation and raw files for you as a part of this service. Here are instructions to use Filezilla if you want a GUI interface Here are instructions to use the command line EXAMPLE Dr. Will Lai has developed a GUI interface for some standard approaches to analyzing ChIP-exo data. You can download the software from his repo - https://github.com/CEGRcode/scriptmanager. A "ScriptManager-Tutorial.docx" is available with step-by-step screenshot tutorials. Here are recordings of Dr. Lai s prior epigenomics training sessions. Download materials are available but videos will require BioHPC account login which is free to members of Cornell community. Please let us know if you would like to schedule a meeting for a consultation on your data and analyses.
