Generation X Wine Purchasers' Segmentation
The US wine industry is diverse with thousands of brands in various price categories. Market segmentation plays a crucial role in developing effective marketing strategies to cater to different consumer preferences. Research shows that generational cohort theory is applicable in segmenting wine consumers, with specific focus on Generation X, Millennials, and other demographics. Differentiation in product offerings is key to providing value to consumers across different generations.

Download Presentation

Please find below an Image/Link to download the presentation.
The content on the website is provided AS IS for your information and personal use only. It may not be sold, licensed, or shared on other websites without obtaining consent from the author.If you encounter any issues during the download, it is possible that the publisher has removed the file from their server.
You are allowed to download the files provided on this website for personal or commercial use, subject to the condition that they are used lawfully. All files are the property of their respective owners.
The content on the website is provided AS IS for your information and personal use only. It may not be sold, licensed, or shared on other websites without obtaining consent from the author.
E N D
Presentation Transcript
Segmentation of Generation X Wine Purchasers by Bottle Price Most Often Author Author Marianne McGarry Wolf, California Polytechnic State University Session 6B June 30, 2023 American Association of Wine Economists 15th Annual Conference Stellenbosch, South Africa
Background The US wine industry is large and diverse with thousands of brands selling wine in numerous price categories. Wines and Vines reported there were 11,546 wineries in the US in January 2023 and almost half, 49%, were classified as limited production, producing less than 1,000 cases (Wines Vines Analytics, 2023).
Background Wines and Vines further reported that only 1% of US wineries produce wines in the less than $11 price range; 61% produce in the $11 to $29.99 price range, and 38% produce in the $30 and higher (Wines Vines Analytics, 2023).
Background Different marketing strategies are needed to reach consumers for the variety of different brands and prices.
Background Marketing strategies are developed using market segmentation and product differentiation to provide value to consumers (Armstrong & Kotler, 2017 A). Demographic, psychographic, geographic and behavioral are typical variables that are used for market segmentation (Armstrong & Kotler, 2017 B).
Background Demographics and Generations Research shows that generational cohort theory is relevant for segmentation in the wine industry (Thach, Riewe, and Camillo, 2020). There have also been studies that examined segmentation within a specific generation. For example, Millennials were segmented by the price of wine purchased in research that revealed differences in the desirability of attributes of a wine brand between the luxury wine and non-luxury wine Millennial wine consumers (Higgins & Wolf, 2015).
Background Demographic Segmentation Wine Consuming Generations Generation Z, born between 1997 and 2012 representing 23.1% of the population; Millennials, born between 1981 and 1996 representing 24.4% of the population; Generation X, born between 1965 and 1980 representing 22.2% of the population; Baby-Boomers, born between 1946 and 1964 representing 23.7% of the population; and the Silent Generation, born between 1928 and 1945 representing 6.4% of the population. US Census in Statista, (2023).
Background Research Purpose The purpose of this research is to examine the Generation X wine consumers to determine if marketing segmentation by wine price purchased most often is a valuable strategy. Three segments are examined by bottle price most often: under $15; $15 to $29.99; and $30+.
Background Research Purpose The three groups of Generation X consumers are segmented by the bottle price most often: They are compared based on Category behaviors The desirability of wine attributes when making a purchase decision. Information sources concerning wine are also examined.
Methodology In January 2021 an online survey using the program Qualtrics was conducted using emails and social media to collect 1,195 responses among wine purchasers. Half, 596, of the respondents were from the demographic, Generation X In 2021, Generation X respondents were between the ages of 41 and 56 years old.
Methodology Price Segments Consumers were asked: Thinking of the wine you purchase for consumption at home, in which of the following price ranges do MOST of the bottles of wine you purchase fall? (Choose one.) $0.00-$4.99 $5.00-$9.99 $10.00-$14.99 $15.00-$19.99 $20.00-$29.99 $30.00-$49.99 $50.00-$79.99 $80.00-$99.99 $100 and higher
Methodology Price Segments MOST of the Bottles of Wine You Purchase for Home Fall A third of respondents were in the under $15 segment Approximately a half were in the $15 to $29.99 segment Only 14% were in the $30+ segment PRICE SEGMENT PRICE SEGMENT MOST BOTTLES MOST BOTTLES PURCHASE FOR PURCHASE FOR HOME HOME N N PERCENTAGE PERCENTAGE Under $15 203 34% $15 to $29.99 310 52% $30+ 83 14%
Methodology Chi-square and Analysis of Variance identify differences between purchasers based on the three purchase price ranges examined. In all tables significant differences are noted using the following: ** Significance at 95% level * Significance at 90% level
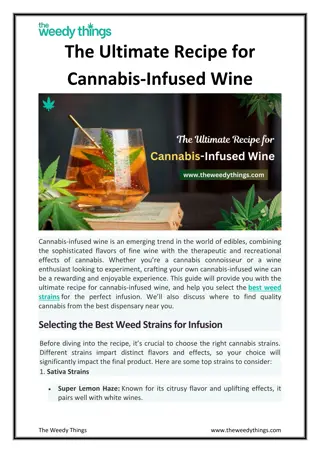
Products Purchased In addition to purchasing wine in the past year, the Generation X consumers purchased a variety of alcoholic beverages. Over half purchased Beer Light beer Spirits Almost half, 49%, of the Generation X consumers also purchased hard seltzer. Recreational cannabis products were consumed by 14% of the Generation X wine consumers.
Products Purchased-Differences between segments Over two-thirds purchased beer, The Under $15 purchasers were more likely to have purchased beer. The consumers in the $30+ segment were more likely to have purchased craft spirits, sparkling wine, and cannabis-infused wine.
Products Purchased Under $15 (N=203) $15 to $29.99 (N=310) 95.2% 73.9% 73.9% 64.8% 64.5% 49.0% 33.5% 33.2% $30+ (N=83) Total (N=596) P Value Types of Products Purchased Past Year Wine Beer Light Beer Sparkling Wine Spirits Hard Seltzer Hard Cider Cooler or other flavored alcoholic drink Craft Spirits Recreational cannabis products Cannabis-infused wine Cannabis-infused spirits Cannabis-infused beer 96.1% 82.3% 69.0% 65.5% 65.0% 47.8% 37.9% 32.0% 98.8% 72.3% 67.5% 77.1% 72.3% 48.2% 25.3% 32.5% 96.0% 76.5% 71.3% 66.8% 65.8% 48.5% 33.9% 32.7% 0.326 0.056* 0.343 0.097* 0.400 0.961 0.121 0.960 0.027** 0.512 0.094* 0.198 0.120 23.2% 13.8% 6.4% 31.9% 14.5% 9.0% 1.6% 1.0% 37.3% 9.6% 14.5% 1.2% 2.4% 29.7% 13.6% 8.9% 1.0% 0.8%
Wine Products Purchased Under Under $15 $15 (N=203) (N=203) 89.2% 87.2% 58.1% 65.5% $15 to $15 to $29.99 $29.99 (N=310) (N=310) 90.6% 82.6% 61.9% 64.8% $30+ $30+ (N=83) (N=83) Total Total (N=596) (N=596) P Value P Value Most Generation X consumers purchased red, white, rose , and sparkling wine. 96.4% 88.0% 67.5% 77.1% 90.9% 0.150 84.9%0.255 61.4%0.325 66.8% Red White Rose' Sparkling The $30+ segment were more likely to have purchased sparkling wine. 0.097*
Number of Bottles Typically Buy And Spend In a typical Moth The under $15 segment purchase more bottles in a typical month $15 to $15 to $29.99 $29.99 (N=310) (N=310) Under $15 Under $15 (N=203) (N=203) $30+ $30+ (N=83) (N=83) Total Total (N=596) (N=596) P Value P Value 7.23 5.73 5.81 6.25 Approximate number of bottles per month 0.028 ** The Over $30 segment spends more in a typical month 110.63 121.66 241.58 135.82 Approximate typical spend per month 0.000 **
Done Past Year The Generation X wine consumers were active, approximately half Participated in a virtual happy hour Went wine tasting Posted a photo of food on social media The $30+ segment were more likely to go wine tasting. Over a third Posted a photo of wine on social media Approximately a fifth purchased a canned wine
Done Past Year Under $15 Under $15 (N=203) (N=203) $15 to $29.99 $15 to $29.99 (N=310) (N=310) $30+ $30+ (N=83) (N=83) Total Total (N=596) (N=596) P P Done Past Year Done Past Year Participated in a virtual happy hour 59.6% 60.3% 59.0% 59.9% 0.97 0.00** 36.9% 52.3% 66.3% 49.0% Went wine tasting Taken a photo of food and posted it on social media Taken a photo of a wine and posted it on social media 51.2% 43.2% 47.0% 46.5% 0.21 32.5% 35.8% 43.4% 35.7% 0.22 25.1% 20.3% 14.5% 21.1% Purchased a canned wine 0.12 9.4% 10.3% 8.4% 9.7% None of the above 0.86
Where Purchase Wine Most Generation X consumers purchased wine at physical locations such as a store, a bar or a restaurant. Approximately a quarter of Generation X wine consumers ordered wine for pick up or ordered wine for delivery to home. However, the $30+ segment of consumers were more likely to have ordered wine for pick-up, 41% and ordered wine for home delivery, 49%. Over a quarter of Generation X consumers ordered wine online using a computer with almost half of the $30+ segment.
Where Purchase Wine Under $15 (N=203) $15 to $29.99 (N=310) 96.5% $30+ (N=83) Total (N=596) P Value Answer I went to a store, bar or restaurant to purchase wine 96.6% 86.7% 95.1% 0.001** 0.000 21.2% 35.8% 69.9% 35.6% I belong to a wine club (s) ** 20.7% 27.7% 49.4% 28.4% 0.000 I ordered wine for delivery to my home ** 21.7% 24.8% 48.2% 27.0% 0.000 I bought wine online using a computer ** 14.3% 24.8% 41.0% 23.5% 0.000 I ordered wine for pick-up I bought wine online using a mobile app ** 6.4% 9.0% 14.5% 8.9% 0.094* Home delivery and online purchasing is important for brands in the 30+ segment selling to Generation X.
Future Online Purchases Under $15 (N=203) $15 to $29.99 (N=310) 21.2% $30+ (N=83) Total (N=596) P Value A third of consumers in the $30+ segment expect to purchase wine online more often for home delivery in the future Compared to a fifth of the other consumers. Online More After COVID Not More Online 21.0% 32.9% 22.8% 0.062 * 79.0% 78.8% 67.1% 77.2% Online purchasing is important for all brands, especially brands in the 30+ segment.
PRODUCT POSITIONING
Positioning Research Positioning research methodology was used to examine the impact of twelve wine attributes on purchase decisions. The twelve attributes were rated by consumers: low in calories, good value for the money, a brand I know, not filling, high quality product, low in alcohol, varietal I like, a good drink for socializing, in sustainable packaging, donates profits to COVID-19 relief efforts, in a package that is easy to bring with me for outdoor activities, and high wine ratings.
Positioning Research Mean ratings were calculated based on a five-point interval scale where Not desirable at all =1 Slightly desirable = 2 Somewhat desirable = 3 Very desirable =4 Extremely desirable = 5
Positioning Research Mean Ratings The very desirable attributes to the Generation X wine consumers were: high quality product, varietal I like, good value for the money, and a good drink for socializing
Positioning Research Mean Ratings The somewhat to very desirable attributes were: high wine ratings, a brand I know, in sustainable packaging, and in a package that is easy to bring with me for outdoor activities.
Positioning Research Mean Ratings The slightly desirable attributes were: donates profits to COVID-19 relief efforts, not filling, low in calories, and low in alcohol.
Mean Rating (N=596) Positioning Research Mean Ratings Very Desirable Very Desirable High Quality product Varietal I like Good value for the money A good drink for socializing Somewhat to Very Desirable Somewhat to Very Desirable High wine ratings A brand I know In sustainable packaging In a package that is easy to bring with me for outdoor activities Slightly Desirable Slightly Desirable Donates profits to COVID-19 relief efforts Not filling Low in calories Low in alcohol 4.28 4.26 3.83 3.82 3.63 3.45 2.72 2.47 2.19 2.13 1.94 1.73
Positioning Research Mean Ratings All generation X consumers agreed on the desirability of: varietal I like, a good drink for socializing, in sustainable packaging, donates profits to COVID-19 relief efforts, not filling and low in alcohol.
Positioning Research Mean Ratings However, the different price segments rated six of the twelve attributes differently. The consumers in the $30+ segment rated the following attributes higher than the consumers in the other segments: high quality product and brand I know.
Positioning Research Mean Ratings The consumers in the $15 and higher segments rated high wine ratings more desirable than those in the $15 and under segment. The consumers in the under $15 segment rated Good value for the money and low in calories higher than the other price segments. The segments in the under $30 ranges rated in a package that is easy to bring outdoors higher than those in the $30+ segment.
Positioning Research Mean Ratings Under $15 (N=203) $15 to $29.99 (N=310) $30+ (N=83) Total (N=596) P Value Very Desirable Very Desirable High Quality product Varietal I like Good value for the money A good drink for socializing Somewhat to Very Desirable Somewhat to Very Desirable High wine ratings A brand I know In sustainable packaging Slightly Desirable Slightly Desirable In a package that is easy to bring with me for outdoor activities Donates profits to COVID-19 relief efforts Not filling Low in calories Low in alcohol 0.000 4.11 4.24 4.12 3.82 4.26 4.26 3.80 3.80 4.77 4.33 3.22 3.87 4.28 4.26 3.83 3.82 ** 0.701 0.000 ** 0.840 0.002 3.43 3.34 2.78 3.69 3.45 2.73 3.87 3.72 2.52 3.63 3.45 2.72 ** 0.010 ** 0.247 2.57 2.49 2.14 2.47 0.009 ** 2.20 2.21 2.15 1.78 2.23 2.11 1.88 1.70 2.00 2.04 1.69 1.77 2.19 2.13 1.94 1.73 0.256 0.484 0.002 ** 0.624
INFORMATION SOURCES
Information Sources for Wine Most Generation X consumers, 79%, indicated they get information about wine from friends and family. The next highest source of information was from visiting a winery. The higher price segments were more likely to get information from Visiting a winery Workers at a bar or wine bar Winery websites Magazines Wine blogs
Information Sources for Wine Over a third of Generation X consumers indicated they get information from workers at a bar or wine bar and the consumers in the higher priced wine segment were more likely. Workers at a retail outlet were also a source for a third of the Generation X consumers. The consumers in the lower price segments were more likely to use display information at a retail outlet.
Information Sources for Wine Under $15 (N=203) $15 to $29.99 (N=310) $30+ (N=83) Total (N=596) P Value Top 5 sources Top 5 sources Friends and family Visiting a winery Workers at a bar or wine bar Workers at a retail outlet Display information at a retail outlet 0.445 81.3% 46.8% 31.0% 38.9% 32.0% 78.4% 56.1% 41.0% 33.9% 24.8% 74.7% 68.7% 41.0% 22.9% 14.5% 78.9% 54.7% 37.6% 34.1% 25.8% 0.003** 0.060* 3.4%** 0.007**
Information Sources for Wine Under $15 (N=203) $15 to $29.99 (N=310) 20.6% 16.5% 9.4% 11.0% 11.6% $30+ (N=83) Total (N=596) P Value Sources for 10% to 20% of Generation X Sources for 10% to 20% of Generation X Winery website Google Magazines Wine Blogs Wine app 13.8% 15.3% 10.3% 6.4% 6.9% 39.8% 18.1% 20.5% 16.9% 13.3% 21.0% 16.3% 11.2% 10.2% 10.2% 0.000** 0.838 0.015** 0.025** 0.140
Information Sources for Wine Under $15 (N=203) $15 to $29.99 (N=310) $30+ (N=83) Total (N=596) P Value Sources for less than 10% of Generation X 6.9% 7.1% 7.2% 7.0% Facebook 0.994 5.4% 6.5% 9.6% 6.5% Instagram 0.422 4.4% 6.8% 7.2% 6.0% A virtural wine tasting 0.491 5.4% 2.9% 3.4% An influencer on social media 0.057* 3.0% 1.9% 2.0% Television 0.269 1.9% 2.4% 1.3% Other Mobile App 0.117 1.0% 0.6% 1.2% 0.8% Twitter 0.850 Social media is low for information, however, over a third of Generation X consumers posted a photo of wine on social media.
Conclusions The research shows that wine marketing strategies should use segmentation based upon wine pricing levels. The consumers that purchase in the three segments that are examined by bottle price most often, under $15; $15 to $29.99, and $30+ Have different purchasing behaviors, Desire different wine attributes, Use different information sources.
THANK YOU! QUESTIONS?
References Armstrong, G. and Kotler, P. (2017A) Marketing, An Introduction. Pearson. NY: USA, p.170. Armstrong, G. and Kotler, P. (2017B) Marketing, An Introduction. Pearson. NY: USA, p.178. Higgins, L.M. & Wolf, M.M. (2015) Millennials as Luxury Wine Buyers in the United States? , International Journal of Wine Business Research, 28 (3), pp. 190-205. MRI-Simmons (2023) Spring 2020 Adult Study 12-Month US, Drank Wine Accessed February 25, 2023 from https://insights-mrisimmons-com.ezproxy.lib.calpoly.edu/essentials/crosstab Thach, L., Riewe, S. and Camillo, A. (2020) Generational cohort theory and wine: analyzing how gen Z differs from other American wine consuming generations ,International Journal of Wine Business Research [online]. Available at https://doi.org/10.1108/IJWBR-12-2019-0061 (Accessed on 24 November 2023). US Census Bureau. (June 30, 2022). Resident population in the United States in 2021, by generation (in millions) [Graph]. In Statista. Retrieved February com.ezproxy.lib.calpoly.edu/statistics/797321/us-population-by-generation/?locale=en 25, 2023, from https://www-statista- Wines Vines Analytics (2023). US Wineries By Winery Size. Wine Analytics Report. [online]. Available at https://winesvinesanalytics.com/statistics/winery/ (Accessed February 21, 2023).