Generating Control-Flow Graphs with Open-Source GCC and Graphviz
The process of generating control-flow graphs using open-source software tools like GCC version 4.8+ and Graphviz. Learn how to create a .dot file using GCC, understand the DOT language for graph description, process the .dot file with Graphviz, and visualize the result. The provided steps and examples will guide you through the generation of control-flow graphs from C files, offering insights into graph manipulation and visualization.

Download Presentation

Please find below an Image/Link to download the presentation.
The content on the website is provided AS IS for your information and personal use only. It may not be sold, licensed, or shared on other websites without obtaining consent from the author.If you encounter any issues during the download, it is possible that the publisher has removed the file from their server.
You are allowed to download the files provided on this website for personal or commercial use, subject to the condition that they are used lawfully. All files are the property of their respective owners.
The content on the website is provided AS IS for your information and personal use only. It may not be sold, licensed, or shared on other websites without obtaining consent from the author.
E N D
Presentation Transcript
Generating Control-Flow Graph using Open-Source S/W GCC: version 4.8+ (recommend 5.x+) Graphviz (for processing .dot file) The original slides were made by Hyunsu Lim bookman01@kaist.ac.kr
Get the target .c file Sample .c file that will be used: sample.c
Generate .dot file using gcc $ gcc -fdump-tree-all-graph <target.c> Or $ gcc -fdump-tree-all-graph-lineno <target.c> For more detailed options, https://gcc.gnu.org/onlinedocs/gcc/Developer-Options.html
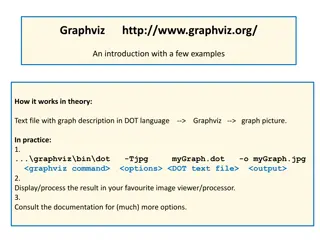
DOT (graph description language) DOT is a plain text graph description language ( *.gv or *.dot) The DOT language defines a graph, but not layout of the graph. Graphviz libraries and utilities to manipulate graphs http://www.webgraphviz.com/ https://commons.wikimedia.org/wiki/Catego ry:Images_with_Dot_source_code digraph finite_state_machine { rankdir=LR; size="8,5" node [shape = doublecircle]; LR_0 def{x} LR_3 LR_4 LR_8; node [shape = circle]; "LR_0 def{x}" -> LR_2 [ label ="SS(B)" ]; "LR_0 def{x}" -> LR_1 [ label = "SS(S)" ]; LR_1 -> LR_3 [ label = "S($end)" ]; LR_2 -> LR_6 [ label = "SS(b)" ]; LR_2 -> LR_5 [ label = "SS(a)" ]; LR_2 -> LR_4 [ label = "S(A)" ]; LR_5 -> LR_7 [ label = "S(b)" ]; LR_5 -> LR_5 [ label = "S(a)" ]; LR_6 -> LR_6 [ label = "S(b)" ]; LR_6 -> LR_5 [ label = "S(a)" ]; LR_7 -> LR_8 [ label = "S(b)" ]; LR_7 -> LR_5 [ label = "S(a)" ]; LR_8 -> LR_6 [ label = "S(b)" ]; LR_8 -> LR_5 [ label = "S(a)" ]; }
Process .dot file using Graphviz You can use http://www.webgraphviz.com/ to generate visual graph from .dot file. Or $ dot -Tpng <target.dot> -o <output.png> <target.dot> file is the file that ends with .cfg.dot In sample case, it is `sample.c.011t.cfg.dot`
Result graph image Warning: Gcc 4.x may generate only cfg of the last function in a taraget C file


")