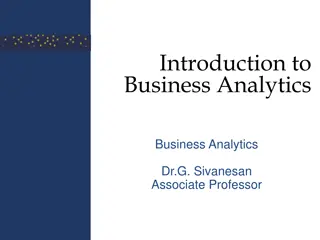
Game Analytics: Types, Steps, and Concepts

 undefined
R
e
v
i
e
w
IMGD 2905
W
h
a
t
a
r
e
t
w
o
m
a
i
n
t
y
p
e
s
o
f
d
a
t
a
f
o
r
g
a
m
e
a
n
a
l
y
t
i
c
s
?
W
h
a
t
a
r
e
t
w
o
m
a
i
n
t
y
p
e
s
o
f
d
a
t
a
f
o
r
g
a
m
e
a
n
a
l
y
t
i
c
s
?
•
Quantitative
– instrumented
game
•
Qualitative
– subjective
evaluation
W
h
a
t
s
t
e
p
s
a
r
e
i
n
t
h
e
g
a
m
e
a
n
a
l
y
t
i
c
s
p
i
p
e
l
i
n
e
?
W
h
a
t
s
t
e
p
s
a
r
e
i
n
t
h
e
g
a
m
e
a
n
a
l
y
t
i
c
s
p
i
p
e
l
i
n
e
?
•
Game
(instrumented)
•
Data
(collected from
players
playing game)
•
Extracted data
(e.g., from scripts)
•
Analysis
•
Statistics, Charts, Tests
•
Dissemination
•
Report
•
Talk, Presentation
W
h
a
t
i
s
p
o
p
u
l
a
t
i
o
n
v
e
r
s
u
s
s
a
m
p
l
e
?
W
h
a
t
i
s
p
o
p
u
l
a
t
i
o
n
v
e
r
s
u
s
s
a
m
p
l
e
?
•
Population
– all members of
group pertaining to study
‒
Typically want
parameter
of
this group
•
Sample
– part of population
selected for analysis
‒
Typically compute
statistic
to
estimate
parameter
W
h
a
t
i
s
p
r
o
b
a
b
i
l
i
t
y
s
a
m
p
l
i
n
g
?
W
h
a
t
i
s
p
r
o
b
a
b
i
l
i
t
y
s
a
m
p
l
i
n
g
?
•
Probability sampling
–
selecting members from the
population group while
considering the likelihood of
selection
‒
Likelihood as part of
population
W
h
a
t
i
s
a
V
a
r
i
a
b
l
e
i
n
S
t
a
t
i
s
t
i
c
s
?
W
h
a
t
i
s
a
V
a
r
i
a
b
l
e
i
n
S
t
a
t
i
s
t
i
c
s
?
•
Any characteristics that can be
measured, classified or counted
‒
e.g., age, eye color, income, high
score, kill-death ratio, vehicle type
‒
e.g., time spent in competitive
mode in
Starcraft 2
‒
e.g., vehicle choice in
Grand Theft
Auto
(GTA)
•
Variables
in columns
•
Independent variable
is inherent
in population, versus
dependent
variable
that want to assess
Player
Hours
Champ
A
2
Leona
B
7.5
Teemo
W
h
a
t
i
s
a
P
a
r
e
t
o
c
h
a
r
t
?
W
h
e
n
u
s
e
d
?
W
h
a
t
i
s
a
P
a
r
e
t
o
c
h
a
r
t
?
W
h
e
n
u
s
e
d
?
•
Used for categorical
data
•
Bar chart, arranged
most to least
frequent
•
Line showing
cumulative percent
•
Helps identify most
common, relative
amounts
W
h
e
n
s
h
o
u
l
d
y
o
u
n
o
t
u
s
e
p
i
e
c
h
a
r
t
?
W
h
e
n
s
h
o
u
l
d
y
o
u
n
o
t
u
s
e
p
i
e
c
h
a
r
t
?
W
h
e
n
s
h
o
u
l
d
y
o
u
n
o
t
u
s
e
p
i
e
c
h
a
r
t
?
•
When too many slices
http://cdn.arstechnica.net/FeaturesByVersion.png
•
(Often) when comparing pies
W
h
e
n
s
h
o
u
l
d
y
o
u
n
o
t
u
s
e
p
i
e
c
h
a
r
t
?
W
h
i
c
h
M
e
a
s
u
r
e
o
f
C
e
n
t
r
a
l
T
e
n
d
e
n
c
y
t
o
U
s
e
?
W
h
y
?
W
h
a
t
a
r
e
Q
u
a
r
t
i
l
e
s
?
W
h
a
t
a
r
e
Q
u
a
r
t
i
l
e
s
?
3 values that divide
population into 4
equal sized groups
D
e
s
c
r
i
b
e
h
o
w
t
o
C
o
m
p
u
t
e
V
a
r
i
a
n
c
e
D
e
s
c
r
i
b
e
h
o
w
t
o
C
o
m
p
u
t
e
V
a
r
i
a
n
c
e
1.
Compute mean
2.
Take a sample and compute
how far it is from mean.
Square this
3.
Repeat #2 for each sample
4.
Add up all
5.
Divide by number of samples
(-1)
W
h
a
t
i
s
M
e
n
d
e
n
h
a
l
l
’
s
E
m
p
i
r
i
c
a
l
R
u
l
e
?
W
h
a
t
i
s
M
e
n
d
e
n
h
a
l
l
’
s
E
m
p
i
r
i
c
a
l
R
u
l
e
?
W
h
a
t
c
a
n
y
o
u
i
n
t
e
r
p
r
e
t
f
r
o
m
a
Z
-
s
c
o
r
e
?
W
h
a
t
c
a
n
y
o
u
i
n
t
e
r
p
r
e
t
f
r
o
m
a
Z
-
s
c
o
r
e
?
•
Where (above or below) score
is relative to the median
•
How “unusual” a score is
I
n
P
r
o
b
a
b
i
l
i
t
y
,
w
h
a
t
i
s
a
n
E
x
h
a
u
s
t
i
v
e
S
e
t
o
f
E
v
e
n
t
s
?
G
i
v
e
a
n
E
x
a
m
p
l
e
.
I
n
P
r
o
b
a
b
i
l
i
t
y
,
w
h
a
t
i
s
a
n
E
x
h
a
u
s
t
i
v
e
S
e
t
o
f
E
v
e
n
t
s
?
G
i
v
e
a
n
E
x
a
m
p
l
e
.
•
A set of all possible outcomes of
an experiment or observation
•
e.g., coin: events {heads, tails}•
e.g., d6: events {even number,odd number}
•
e.g., picking Champion in LoL:
events {Shen, Teemo, Leona, …}(all possible Champions listed)
W
h
a
t
N
u
m
e
r
i
c
V
a
l
u
e
s
d
o
P
r
o
b
a
b
i
l
i
t
i
e
s
t
a
k
e
?
W
h
a
t
N
u
m
e
r
i
c
V
a
l
u
e
s
d
o
P
r
o
b
a
b
i
l
i
t
i
e
s
t
a
k
e
?
•
Probabilities must be
between 0 and 1
(but often
written/said as
percent
)
•
Probabilities of set of
exhaustive
,
mutually
exclusive
events must
add
up to 1
P
r
o
b
a
b
i
l
i
t
y
•
Draw 1 card. What is
the probability
drawing a Jack?
Poll 1!
P
r
o
b
a
b
i
l
i
t
y
•
Draw 1 card. What is
the probability
drawing a Jack?
Poll 1!
P(J) =
2 favorable outcomes /
5 total outcomes
= 2/5
P
r
o
b
a
b
i
l
i
t
y
•
Draw 2 cards
simultaneously. What
is the probability of
drawing 2 Jacks?
Poll 2!
P
r
o
b
a
b
i
l
i
t
y
•
Draw 2 cards
simultaneously. What
is the probability of
drawing 2 Jacks?
P(2J) = P(J) x P(J | J)
= 2/5 x 1/4
= 1/10
Poll 2!
P
r
o
b
a
b
i
l
i
t
y
•
Draw 3 cards
simultaneously. What is
the probability of
not
drawing at least one King?
Poll 3!
P
r
o
b
a
b
i
l
i
t
y
•
Draw 3 cards
simultaneously. What is
the probability of
not
drawing at least one King?
P(K’) x P(K’ | K’) x P(K’ | K’K’)
= 3/5 x 2/4 x 1/3
= 6/60
= 1/10
Poll 3!
C
h
a
r
a
c
t
e
r
i
s
t
i
c
s
o
f
a
n
e
x
p
e
r
i
m
e
n
t
w
i
t
h
a
B
i
n
o
m
i
a
l
D
i
s
t
r
i
b
u
t
i
o
n
o
f
o
u
t
c
o
m
e
s
?
C
h
a
r
a
c
t
e
r
i
s
t
i
c
s
o
f
a
n
e
x
p
e
r
i
m
e
n
t
w
i
t
h
a
B
i
n
o
m
i
a
l
D
i
s
t
r
i
b
u
t
i
o
n
o
f
o
u
t
c
o
m
e
s
?
•
Experiment consists of
n
independent,
identical trials
•
Each trial results in
only success or failure
(probability
p
for
success for each)
•
Random variable of
interest (
X
) is number
of
successes
in
n
trials
C
h
a
r
a
c
t
e
r
i
s
t
i
c
s
o
f
a
n
e
x
p
e
r
i
m
e
n
t
w
i
t
h
a
P
o
i
s
s
o
n
D
i
s
t
r
i
b
u
t
i
o
n
o
f
o
u
t
c
o
m
e
s
?
C
h
a
r
a
c
t
e
r
i
s
t
i
c
s
o
f
a
n
e
x
p
e
r
i
m
e
n
t
w
i
t
h
a
P
o
i
s
s
o
n
D
i
s
t
r
i
b
u
t
i
o
n
o
f
o
u
t
c
o
m
e
s
?
1.
Interval (e.g., time) with
units
2.
Probability of event
same for all interval units
3.
Number of events in one
unit independent of
others
4.
Events occur singly (not
simultaneously)
5.
Random variable of
interest (
X
) is number of
events
that occur in an
interval
Phrase people use is
“random arrivals”
E
x
p
e
c
t
e
d
V
a
l
u
e
What is average if don’t bust?
A = HT + TH + HH = (1 + 1 + 2) / 3 = 4/3
What is the expected value after 1 toss?
E(X)
= P(TT) * 0 + (1- P(TT)) * 4/3
= ¾ * 4/3
= 1
2 tosses?
E(X)
= (1-P(TT))
2
* (4/3 * 2)
= ¾ * ¾ * 8/3
= 1.5
3 tosses?
E(X)
= (1-P(TT))
3
* (4/3 * 3)
= ¾ * ¾ * ¾ * 12/3
= 1.6875
Toss: Flip 2 coins
Each Head gives 1 point
2 Tails
bust, turn over
BEST_BOT?
Poll!
E
x
p
e
c
t
e
d
V
a
l
u
e
What is average if don’t bust?
A = HT + TH + HH = (1 + 1 + 2) / 3 = 4/3
What is the
expected value
after 1 toss?
E(X)
= P(TT) * 0 + (1- P(TT)) * 4/3
= ¾ * 4/3
= 1
2 tosses?
E(X)
= (1-P(TT))
2
* (4/3 * 2)
= ¾ * ¾ * 8/3
= 1.5
3 tosses?
E(X)
= (1-P(TT))
3
* (4/3 * 3)
= ¾ * ¾ * ¾ * 12/3
= 1.6875
Toss: Flip 2 coins
Each Head gives 1 point
2 Tails
bust, turn over
BEST_BOT?
W
h
a
t
i
s
t
h
e
S
t
a
n
d
a
r
d
N
o
r
m
a
l
D
i
s
t
r
i
b
u
t
i
o
n
?
W
h
a
t
i
s
t
h
e
S
t
a
n
d
a
r
d
N
o
r
m
a
l
D
i
s
t
r
i
b
u
t
i
o
n
?
μ
= 0
•
Normal distribution
•
Mean
μ
= 0
•
Std dev
σ
= 1
W
h
a
t
i
s
t
h
e
C
e
n
t
r
a
l
L
i
m
i
t
T
h
e
o
r
e
m
?
W
h
a
t
i
s
t
h
e
C
e
n
t
r
a
l
L
i
m
i
t
T
h
e
o
r
e
m
?
•
Given population
•
If take large enough sample size
•
What does probability of
sample means look like?
Distribution shape?
W
h
a
t
i
s
t
h
e
C
e
n
t
r
a
l
L
i
m
i
t
T
h
e
o
r
e
m
?
•
Given population
•
If take large enough sample size
•
What does probability of
sample means look like?
Distributed Normally
How big is
“enough”?
W
h
a
t
i
s
t
h
e
C
e
n
t
r
a
l
L
i
m
i
t
T
h
e
o
r
e
m
?
•
Given population
•
If take large enough sample size
•
What does probability of
sample means look like?
Distributed Normally
How big is
“enough”?
•
30
•
(15)
Does
underlying
distribution
matter?
W
h
a
t
i
s
t
h
e
C
e
n
t
r
a
l
L
i
m
i
t
T
h
e
o
r
e
m
?
•
Given population
•
If take large enough sample size
•
What does probability of
sample means look like?
Distributed Normally
How big is
“enough”?
•
30
•
(15)
Does
underlying
distribution
matter?
•
No
(see next slide)
U
n
d
e
r
l
y
i
n
g
D
i
s
t
r
i
b
u
t
i
o
n
d
o
e
s
n
o
t
M
a
t
t
e
r
Why do we care?
Can apply rules
(e.g., empirical rule) to
Normal Distributions
!
S
a
m
p
l
i
n
g
E
r
r
o
r
•
What is sampling error?
S
a
m
p
l
i
n
g
E
r
r
o
r
•
What is sampling error?
‒
Inaccuracy from estimating
population
parameters from
sample
statistics
•
Size
of error is based on what
two main factors?
S
a
m
p
l
i
n
g
E
r
r
o
r
•
What is sampling error?
‒
Inaccuracy from estimating
population
parameters from
sample
statistics
•
Size
of error is based on what
two main factors?
‒
Population variance
‒
Sample size (
N
)
S
t
a
t
i
s
t
i
c
v
e
r
s
u
s
S
a
m
p
l
e
S
i
z
e
•
Suppose wanted to know
likelihood that WPI student played
Hearthstone
‒
Ask
N
people, count “
yes”
and
divide by
N
•
Ask
1
person?
•
Ask
2
people?
•
Ask
100
people?
•
What does graph of
“yes”
probability versus
N
people look
like?
S
t
a
t
i
s
t
i
c
v
e
r
s
u
s
S
a
m
p
l
e
S
i
z
e
•
Likelihood played
Hearthstone
‒
Ask
N
people, count
“yes”
, divide by
N
C
o
n
f
i
d
e
n
c
e
I
n
t
e
r
v
a
l
s
•
What is a confidence interval?
Give an example
C
o
n
f
i
d
e
n
c
e
I
n
t
e
r
v
a
l
s
•
What is a confidence interval?
Give an example
‒
Range of values with specific
certainty that population
parameter is within
‒
95%
confidence interval for mean
time to complete level in Super
Mario: [
1.25
minutes,
1.75
minutes]
I
n
t
e
r
p
r
e
t
i
n
g
C
o
n
f
i
d
e
n
c
e
I
n
t
e
r
v
a
l
s
•
Assume bars are
conference intervals
•
Interpret difference in
old
versus
new
I
n
t
e
r
p
r
e
t
i
n
g
C
o
n
f
i
d
e
n
c
e
I
n
t
e
r
v
a
l
s
•
Assume bars are
conference intervals
•
Interpret difference in
old
versus
new
•
Large overlap
•
No statistically significant
difference (at given
level)
Helpful hint
: ignore sample means.
Think about population means for
Old
and
New
H
y
p
o
t
h
e
s
i
s
T
e
s
t
i
n
g
•
Assume we wanted to test if the world
was round
•
What is the
Null Hypothesis
?
‒
The world is flat
•
What is the
Alternate Hypothesis
?
‒
Contrary to null hypothesis (i.e., the world
is round)
•
Which do we test and
why
?
‒
Test
Null
‒
Data can only reject hypothesis, not prove
Reject
Null
POLL
H
y
p
o
t
h
e
s
i
s
T
e
s
t
i
n
g
•
Assume we wanted to test if the world
was round
•
What is the
Null Hypothesis
?
‒
The world is flat
•
What is the
Alternate Hypothesis
?
‒
Contrary to Null Hypothesis (i.e., the world
is round)
•
Which do we test and
why
?
‒
Test
Null
‒
Data can only reject hypothesis, not prove
Reject
Null
S
t
e
p
s
i
n
H
y
p
o
t
h
e
s
i
s
T
e
s
t
i
n
g
•
Studio has new model for Hero
•
Want to see if played more often
Steps?
1.
Set
hypotheses
2.
Gather data
3.
Compute sample mean
4.
Test (compute
p value
)
5.
Analyze results to accept or
reject
S
t
e
p
s
i
n
H
y
p
o
t
h
e
s
i
s
T
e
s
t
i
n
g
•
Studio has new model for Hero
•
Want to see if played more often
Steps?
1.
Set
hypotheses
2.
Gather data
3.
Compute sample mean
4.
Test (compute
p value
)
5.
Analyze results to
accept
or
reject
H
y
p
o
t
h
e
s
i
s
T
e
s
t
i
n
g
•
Gathered “new” data,
computed sample mean,
created
Null
hypothesis (
H
0
),
chose significance (
= 0.01)
•
C
alculate
p value
= 0.05
•
Make inference: CAN or
CANNOT reject
H
0
?
‒
CANNOT reject
H
0
•
What does that mean?
‒
May be no difference between
“new” mean and population
mean (at 0.01 significance)
POLL
I
n
t
e
r
p
r
e
t
P
V
a
l
u
e
•
Gathered “new” data,
computed sample mean,
created
Null
hypothesis (
H
0
),
chose significance (
= 0.01)
•
C
alculate
p value
= 0.05
•
Make inference: CAN or
CANNOT reject
H
0
?
‒
CANNOT reject
H
0
•
What does that mean?
‒
May be no difference between
“new” mean and population
mean (at 0.01 significance)
R
e
g
r
e
s
s
i
o
n
•
What is the purpose of
regression in data analytics?
‒
To predict an unobserved value
from a mathematical model
R
e
g
r
e
s
s
i
o
n
•
What is the purpose of
regression in data analytics?
‒
To
predict
an unobserved value
from a mathematical model
R
e
g
r
e
s
s
i
o
n
•
What is the purpose of
regression in data analytics?
‒
To
predict
an unobserved value
from a mathematical model
•
What is simple linear
regression?
‒
A linear model relating two
variables/factors
‒
m
is slope,
b
is y-intercept
Y =
m
X +
b
POLL
R
e
g
r
e
s
s
i
o
n
•
What is the purpose of
regression in data analytics?
‒
To
predict
an unobserved value
from a mathematical model
•
What is simple linear
regression?
‒
A linear model relating two
variables/factors
‒
m
is slope,
b
is y-intercept
Y =
m
X +
b
R
e
g
r
e
s
s
i
o
n
•
If market value of a house can be represented
by the model:
value
= 32673 + 35.036
x
(
square feet
)
•
How do you interpret the model? How can
you use it?
‒
Intercept is 32673. So, base house value is $33k.
‒
Slope is 35.036. So, every square foot increases
house value by $35
‒
Given square feet, predict value:
1800
sq feet
value
= 32673 + 35.036 x (
1800
) = $95,737.80
POLL
R
e
g
r
e
s
s
i
o
n
•
If market value of a house can be represented
by the model:
value
= 32673 + 35.036
x
(
square feet
)
•
How do you interpret the model? How can
you use it?
‒
Intercept is 32673. So, base house value is $33k.
‒
Slope is 35.036. So, every square foot increases
house value by $35
‒
Given square feet, predict value:
1800
sq feet
value
= 32673 + 35.036 x (
1800
) = $95,737.80
W
h
a
t
i
s
t
h
e
C
o
e
f
f
i
c
i
e
n
t
o
f
D
e
t
e
r
m
i
n
a
t
i
o
n
(
R
2
)
?
POLL
W
h
a
t
i
s
t
h
e
C
o
e
f
f
i
c
i
e
n
t
o
f
D
e
t
e
r
m
i
n
a
t
i
o
n
(
R
2
)
?
W
h
a
t
i
s
t
h
e
C
o
e
f
f
i
c
i
e
n
t
o
f
D
e
t
e
r
m
i
n
a
t
i
o
n
(
R
2
)
?
R
2
= 1 -
Variation in
observed
data model
cannot
explain
(error)
Total
variation in
observed
data
W
h
a
t
i
s
t
h
e
v
a
l
u
e
o
f
R
2
?
A
W
h
a
t
i
s
t
h
e
v
a
l
u
e
o
f
R
2
?
B
W
h
a
t
i
s
t
h
e
v
a
l
u
e
o
f
R
2
?
C
W
h
a
t
i
s
t
h
e
v
a
l
u
e
o
f
R
2
?
D
W
h
a
t
i
s
t
h
e
v
a
l
u
e
o
f
R
2
?
R
2
= 0
R
2
= 0.8
R
2
= 0.2
R
2
= 1
Explore the world of game analytics by learning about the two main types of data - quantitative and qualitative, the steps involved in the analytics pipeline, the difference between population and sample, probability sampling, and the concept of variables in statistics.

Download Presentation

Please find below an Image/Link to download the presentation.
The content on the website is provided AS IS for your information and personal use only. It may not be sold, licensed, or shared on other websites without obtaining consent from the author.If you encounter any issues during the download, it is possible that the publisher has removed the file from their server.
You are allowed to download the files provided on this website for personal or commercial use, subject to the condition that they are used lawfully. All files are the property of their respective owners.
The content on the website is provided AS IS for your information and personal use only. It may not be sold, licensed, or shared on other websites without obtaining consent from the author.
E N D
Presentation Transcript
Review Review IMGD 2905
What are two main What are two main types of for game analytics? for game analytics? types of data data
What are two main What are two main types of data for game analytics? for game analytics? types of data Quantitative instrumented game Qualitative subjective evaluation
What steps are in the What steps are in the game analytics pipeline game analytics pipeline? ?
What steps are in the What steps are in the game analytics pipeline game analytics pipeline? ? Game (instrumented) Data (collected from players playing game) Extracted data (e.g., from scripts) Analysis Statistics, Charts, Tests Dissemination Report Talk, Presentation
What is What is population population versus versus sample sample? ?
What is What is population population versus versus sample sample? ? Population all members of group pertaining to study Typically want parameter of this group Sample part of population selected for analysis Typically compute statistic to estimate parameter
What is What is probability sampling probability sampling? ?
What is What is probability sampling probability sampling? ? Probability sampling selecting members from the population group while considering the likelihood of selection Likelihood as part of population
What is a What is a Variable Variable in Statistics? in Statistics?
What is a What is a Variable Variable in Statistics? in Statistics? Any characteristics that can be measured, classified or counted e.g., age, eye color, income, high score, kill-death ratio, vehicle type e.g., time spent in competitive mode in Starcraft 2 e.g., vehicle choice in Grand Theft Auto (GTA) Variables in columns Independent variable is inherent in population, versus dependent variable that want to assess Player Hours Champ A 2 B 7.5 Leona Teemo
What is a What is a Pareto chart Pareto chart? ? When used? When used?
What is a What is a Pareto chart Pareto chart? ? When used? When used? Used for categorical data Bar chart, arranged most to least frequent Line showing cumulative percent Helps identify most common, relative amounts
When should you When should you not not use use pie chart pie chart? ?
When should you When should you not not use use pie chart pie chart? ?
When should you When should you not not use use pie chart pie chart? ? http://cdn.arstechnica.net/FeaturesByVersion.png When too many slices
When should you When should you not not use use pie chart pie chart? ? (Often) when comparing pies
Which Which Measure of Central Measure of Central Tendency Tendency to Use? Why? to Use? Why?
What are What are Quartiles Quartiles? ?
What are What are Quartiles Quartiles? ? 3 values that divide population into 4 equal sized groups
Describe how to Describe how to Compute Compute Variance Variance
Describe how to Describe how to Compute Compute Variance Variance 1. Compute mean 2. Take a sample and compute how far it is from mean. Square this 3. Repeat #2 for each sample 4. Add up all 5. Divide by number of samples (-1)
What is Mendenhalls What is Mendenhall s Empirical Rule? Empirical Rule?
What is Mendenhalls What is Mendenhall s Empirical Rule? Empirical Rule? https://mathbitsnotebook.com/Algebra1/StatisticsData/normalgrapha.jpg
What can you interpret What can you interpret from a Z from a Z- -score? score?
What can you interpret What can you interpret from a Z from a Z- -score? Where (above or below) score is relative to the median How unusual a score is score?
In Probability, what is an In Probability, what is an Exhaustive Set of Events? Give an Example. of Events? Give an Example. Exhaustive Set
In Probability, what is an In Probability, what is an Exhaustive Set of Events? Give an Example. of Events? Give an Example. Exhaustive Set A set of all possible outcomes of an experiment or observation e.g., coin: events {heads, tails} e.g., d6: events {even number, odd number} e.g., picking Champion in LoL: events {Shen, Teemo, Leona, } (all possible Champions listed)
What What Numeric Values Numeric Values do Probabilities take? Probabilities take? do
What What Numeric Values Numeric Values do Probabilities take? Probabilities take? do Probabilities must be between 0 and 1 (but often written/said as percent) Probabilities of set of exhaustive, mutually exclusive events must add up to 1
Probability Probability Poll 1! Draw 1 card. What is the probability drawing a Jack?
Probability Probability Poll 1! Draw 1 card. What is the probability drawing a Jack? P(J) = 2 favorable outcomes / 5 total outcomes = 2/5
Probability Probability Poll 2! Draw 2 cards simultaneously. What is the probability of drawing 2 Jacks?
Probability Probability Poll 2! Draw 2 cards simultaneously. What is the probability of drawing 2 Jacks? P(2J) = P(J) x P(J | J) = 2/5 x 1/4 = 1/10
Probability Probability Poll 3! Draw 3 cards simultaneously. What is the probability of not drawing at least one King?
Probability Probability Poll 3! Draw 3 cards simultaneously. What is the probability of not drawing at least one King? P(K ) x P(K | K ) x P(K | K K ) = 3/5 x 2/4 x 1/3 = 6/60 = 1/10
Characteristics of an Characteristics of an experiment with a experiment with a Binomial Distribution Distribution of outcomes? of outcomes? Binomial
Characteristics of an Characteristics of an experiment with a experiment with a Binomial Distribution Distribution of outcomes? of outcomes? Experiment consists of n independent, identical trials Each trial results in only success or failure (probability p for success for each) Random variable of interest (X) is number of successes in n trials Binomial
Characteristics of an Characteristics of an experiment with a experiment with a Poisson Distribution Distribution of outcomes? of outcomes? Poisson
Characteristics of an Characteristics of an experiment with a experiment with a Poisson Distribution Distribution of outcomes? of outcomes? 1. Interval (e.g., time) with units 2. Probability of event same for all interval units 3. Number of events in one unit independent of others 4. Events occur singly (not simultaneously) 5. Random variable of interest (X) is number of events that occur in an interval Poisson Phrase people use is random arrivals
Expected Value Expected Value What is average if don t bust? Toss: Flip 2 coins Each Head gives 1 point 2 Tails bust, turn over A = HT + TH + HH = (1 + 1 + 2) / 3 = 4/3 Poll! What is the expected value after 1 toss? E(X) = P(TT) * 0 + (1- P(TT)) * 4/3 = * 4/3 = 1 2 tosses? E(X) = (1-P(TT))2 * (4/3 * 2) = * * 8/3 = 1.5 3 tosses? E(X) = (1-P(TT))3 * (4/3 * 3) = * * * 12/3 BEST_BOT? = 1.6875
Expected Value Expected Value What is average if don t bust? Toss: Flip 2 coins Each Head gives 1 point 2 Tails bust, turn over A = HT + TH + HH = (1 + 1 + 2) / 3 = 4/3 What is the expected value after 1 toss? E(X) = P(TT) * 0 + (1- P(TT)) * 4/3 Poll! = * 4/3 = 1 2 tosses? E(X) = (1-P(TT))2 * (4/3 * 2) = * * 8/3 = 1.5 3 tosses? E(X) = (1-P(TT))3 * (4/3 * 3) = * * * 12/3 BEST_BOT? = 1.6875
Expected Value Expected Value What is average if don t bust? Toss: Flip 2 coins Each Head gives 1 point 2 Tails bust, turn over A = HT + TH + HH = (1 + 1 + 2) / 3 = 4/3 What is the expected value after 1 toss? E(X) = P(TT) * 0 + (1- P(TT)) * 4/3 = * 4/3 = 1 2 tosses? E(X) = (1-P(TT))2 * (4/3 * 2) Poll! = * * 8/3 = 1.5 3 tosses? E(X) = (1-P(TT))3 * (4/3 * 3) = * * * 12/3 BEST_BOT? = 1.6875
Expected Value Expected Value What is average if don t bust? Toss: Flip 2 coins Each Head gives 1 point 2 Tails bust, turn over A = HT + TH + HH = (1 + 1 + 2) / 3 = 4/3 What is the expected value after 1 toss? E(X) = P(TT) * 0 + (1- P(TT)) * 4/3 = * 4/3 = 1 2 tosses? E(X) = (1-P(TT))2 * (4/3 * 2) = * * 8/3 = 1.5 3 tosses? E(X) = (1-P(TT))3 * (4/3 * 3) = * * * 12/3 BEST_BOT? = 1.6875
Expected Value Expected Value What is average if don t bust? Toss: Flip 2 coins Each Head gives 1 point 2 Tails bust, turn over A = HT + TH + HH = (1 + 1 + 2) / 3 = 4/3 What is the expected value after 1 toss? E(X) = P(TT) * 0 + (1- P(TT)) * 4/3 = * 4/3 = 1 2 tosses? E(X) = (1-P(TT))2 * (4/3 * 2) = * * 8/3 = 1.5 3 tosses? E(X) = (1-P(TT))3 * (4/3 * 3) = * * * 12/3 BEST_BOT? = 1.6875
Expected Value Expected Value What is average if don t bust? Toss: Flip 2 coins Each Head gives 1 point 2 Tails bust, turn over A = HT + TH + HH = (1 + 1 + 2) / 3 = 4/3 What is the expected value after 1 toss? E(X) = P(TT) * 0 + (1- P(TT)) * 4/3 = * 4/3 = 1 2 tosses? E(X) = (1-P(TT))2 * (4/3 * 2) = * * 8/3 = 1.5 3 tosses? E(X) = (1-P(TT))3 * (4/3 * 3) = * * * 12/3 BEST_BOT? = 1.6875
What is the What is the Standard Normal Distribution Normal Distribution? ? Standard
What is the What is the Standard Normal Distribution Normal Distribution? ? Standard Normal distribution Mean = 0 Std dev = 1 = 0
What is the What is the Central Limit Theorem Central Limit Theorem? ?
What is the What is the Central Limit Theorem Central Limit Theorem? ? Given population If take large enough sample size What does probability of sample means look like? Distribution shape?