Future Changes in East Antarctic Ice Sheet: A Climate Perspective
The East Antarctic Ice Sheet (EAIS) holds significant potential for future sea-level rise, with ongoing mass loss attributed to various factors like ice dynamics and oceanic influences. Predictions for the next 100 years suggest a scenario of rising global and ocean temperatures, impacting basal melting, ice discharge, and overall mass balance of the EAIS. Understanding these changes is crucial for assessing the potential impact on sea levels and climate systems.
Download Presentation

Please find below an Image/Link to download the presentation.
The content on the website is provided AS IS for your information and personal use only. It may not be sold, licensed, or shared on other websites without obtaining consent from the author. Download presentation by click this link. If you encounter any issues during the download, it is possible that the publisher has removed the file from their server.
E N D
Presentation Transcript
The mass temperature sensitivity balance of to East air Antarctic and ocean Jim Jordan1, Hilmar Gudmundsson1, Adrian Jenkins1, Bertie Miles2, Chris Stokes2and Stuart Jamieson2 Work funded by NERC grant :NE/R000719/1 Jim.Jordan@Northumbria.ac.uk 1 Geography and Environmental Sciences, Northumbria University 2 Department of Geography, Durham University
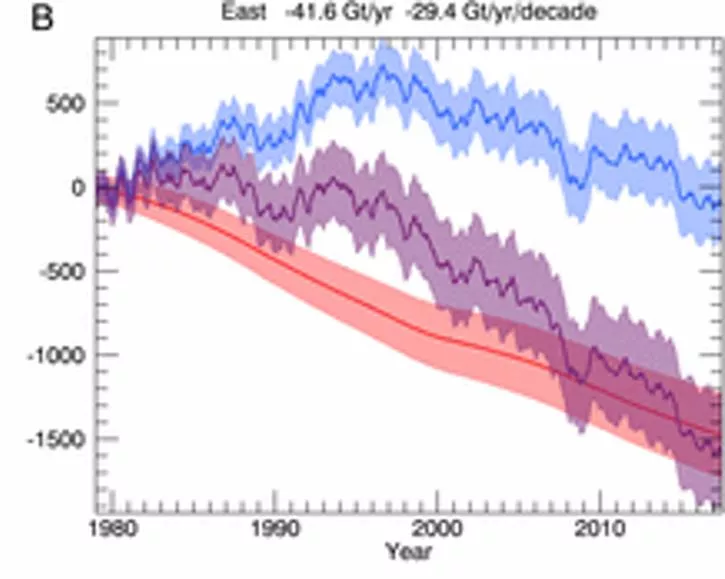
The current state of the East Antarctic Ice Sheet (EAIS) Largest single potential contributor to future sea-level rise, containing ~54 m of potential global mean sea level rise. Despite this large potential, the EAIS is comparatively less studied than the faster changing WAIS. Recent estimates show the EAIS to be losing mass (although at a slower rate than West Antarctica). Whilst there is a large amount of variability in SMB, the overall mass trend is driven by ice dynamics. When considering the dynamics effecting ice discharge, the ability of ice shelves to retard inland flow is of crucial importance. The water mass currently driving the melting of East Antarctic ice shelves is relatively cool, Antarctic Bottom Water (ABW), although incursions of warmer Circumpolar Deep Water (CDW) have been observed in several locations. SMB (blue), ice discharge (red) and total mass (red) of the EAIS since 1980 (Rignot et. al., 2019)
How the EAIS is likely to change over the next 100 years Global temperatures are expected to rise, including for East Antarctica. Oceanic temperatures are likewise expected to rise, leading to increased basal melting causing an increase in ice discharge due to a reduction in ice-shelf buttressing. As well as general oceanic warming, there is the potential of a regime shift with warm CDW replacing cooler ABW in driving ice-shelf melting. Warmer air temperatures are expected to lead to a rise in precipitation, leading to an increase in SMB.
How the EAIS is likely to change over the next 100 years (Ocean) CDW Temperature Salinity Observations 1.371 ( C) 34.673 RCP 4.5 change +0.334 -0.005 RCP 8.5 change +0.412 -0.009 Table of predicted change in water mass properties from an ensemble of CMIP 5 simulations, adapted from Sallee et. al, 2015.
How the EAIS is likely to change over the next 100 years (Atmosphere) Expected air temperature change and precipitation increase from CMIP5 model ensemble (Palerme et al, 2016)
Aims Determine how the EAIS mass balance is likely to change over the next 100 years. Assess the impact of different climate scenarios upon the EAIS mass balance. Assess the potential change in EAIS mass balance arising from a regime shift from predominantly ABW driven melting to CDW driven melting. Determine to what extent increased precipitation could counterbalance increased oceanic melting.
Methodology a ice model, with precipitation given by RACMO (Van Wessem et al, 2014) and oceanic melting derived from the PICO box model (Reese et al, 2018). RACMO field is uniformly increased by 7% per degree of warming, assuming RCP 4.5 leads to 2 degrees of warming and RCP 8.5 leads to 4 degrees. PICO is calibrated to match current area averaged ice shelf melt-rates using current day observations of ocean temperature and salinity. The temperature and salinity used by PICO are then increased by the expected change over 100 years for ABW (ABW forcing) or increased to the expected change over 100 years for CDW in addition to the average difference between ABW and CDW water masses (CDW forcing). All temperature forcings are applied linearly over 100 years of model run time. To account for model bias, all results are given in relation to a reference run with current day forcings applied for 100 years.
Methodology - Schematic RACMO precipitation model Air temperature change Precipitation a Ice model Change in EAIS mass PICO box ocean model Melting Ocean properties change
Results - Disclaimer Please bear in mind that results are very much work in progress, and should be considered as such. Initial simulations have been performed, but investigations into model sensitivity to various parameters are still ongoing. All results are shown in reference to a base simulation with present day forcing, therefore plots show this relative change in ice volume above flotation, ice volume or grounded ice area rather than absolute values.
Volume above floatation, broken down by region Melt forcing
Ice volume, broken down by region
Grounded area, broken down by region
Discussion points The whole of the EAIS When considered as a whole, simulations show the EAIS gaining ice volume above floatation over the next 100 years, with inland snowfall more than counterbalancing increased ice discharge from ocean induced melt. Going from RCP 4.5 to RCP 8.5 conditions has a relatively larger increase for air temperature (increased mass via precipitation) than ocean temperature (decreased mass via ocean melting) compared to going from present day conditions to RCP 4.5. For cold ocean conditions, RCP 4.5 has little change in ice volume whilst there is a small increase in ice volume for RCP 8.5. For warm ocean conditions, total ice volume decreases in both RCP 4.5 and RPC 8.5 as increased ocean melting counters increased precipitation. Volume above floatation still increases despite a decrease in total ice volume due to inland precipitation outweighing melting of floating ice.
Discussion points Individual regions Individual catchments do not behave identically to each other. Rignot catchments K-A (Brunt Ice Shelf area), B-C (Amery Ice Shelf) and C-Cp (Shackleton-Denman Ice Shelf area) appear to have the least increase (or greatest decrease) in VAF. Rignot catchments Ap-B (Shirase Ice shelf area), Cp-D (Totten Ice Shelf area), D-Dp (Cook Ice Shelf area) have the greatest increase in VAF.
Conclusion Increased precipitation from a warming atmosphere has the potential to offset increased ice discharge from a warming ocean in regards to the mass balance of the EAIS over the next 100 years. A reduction in grounded ice sheet area (and hence a reduction in volume above floatation) is more than compensated by inland precipitation. Simulations show that if East Antarctic ice-shelf melt continues to be driven by Antarctic Bottom Water, then total ice volume is likely to be kept approximately constant, or actually slightly increase under the warmest air temperatures. However, if ocean melting becomes predominantly driven by Circumpolar Deep Water then ice volume will decrease due to floating ice shelves melting, even if the volume of grounded ice above flotation increases. In the case of the EAIS, the relative increase in VAF from precipitation and decrease in VAF from increased ice discharge are of roughly similar magnitudes. Small changes in the assumptions used here are likely to affect not just the magnitude of future mass balance change, but potentially also the sign.


