Flowcharts: A Visual Guide to Algorithms
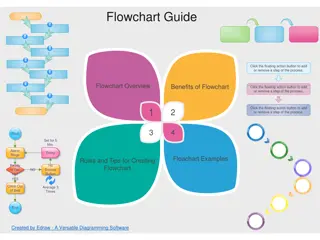
Flowcharts are visual diagrams that depict the steps of an algorithm using symbols and arrows to illustrate the flow of a solution model for a given problem. They help in understanding processes, decision-making points, and logic flows in a structured manner. Flowcharts use symbols like ovals, rectangles, and diamonds to represent different elements of the algorithm. This collection of flowcharts covers topics such as algorithm steps, problem-solving approaches, and decision-making processes in a clear and organized way.

Download Presentation

Please find below an Image/Link to download the presentation.
The content on the website is provided AS IS for your information and personal use only. It may not be sold, licensed, or shared on other websites without obtaining consent from the author.If you encounter any issues during the download, it is possible that the publisher has removed the file from their server.
You are allowed to download the files provided on this website for personal or commercial use, subject to the condition that they are used lawfully. All files are the property of their respective owners.
The content on the website is provided AS IS for your information and personal use only. It may not be sold, licensed, or shared on other websites without obtaining consent from the author.
E N D
Presentation Transcript
Flowcharts CPSC 1301K Columbus State University Dr. Hyrum Carroll (based on material from Hillary Fleenor) 1
Flowcharts A flowchart is a diagram that represents the steps of an algorithm using visual representations along with arrows indicating flow to illustrate a solution model to a given problem.
Example Flowcharts How to make a friend
What are you going to do if the lamp does not work? Check if the lamp is plugged in If it is not plugged in Then plug it in else check the bulb If the bulb is burned out Then replace the bulb else buy new lamp ordered unambiguous executable Algorithm
What are you going to do if the lamp does not work? Check if the lamp is plugged in If it is not plugged in Then plug it in else check the bulb If the bulb is burned out Then replace the bulb else buy new lamp Lamp doesn t work Lamp plugge d in? No Plug in lamp Yes Bulb burned out? Yes Replace bulb No Buy new lamp
Lamp doesnt work Lamp plugge d in? No Plug in lamp Yes Try bulb Bulb burned out? No Use bulb Yes No More bulbs? Buy new lamp Yes
Flowcharts Symbols Name Symbol Use in Flowchart Oval Beginning and ending nodes Flow line Direction of the logic flow Rectangle A process to be carried out Diamond A decision; the flow will continue along 1 of the 2 lines coming from it


![textbook$ What Your Heart Needs for the Hard Days 52 Encouraging Truths to Hold On To [R.A.R]](/thumb/9838/textbook-what-your-heart-needs-for-the-hard-days-52-encouraging-truths-to-hold-on-to-r-a-r.jpg)