Financial Ratings And Recovery Rates
Commercial paper ratings, CLO capital structures, default rates for high-yield bonds, average dollar recovery per $100 par value, discounted recovery rates by debt type, and S&P's secured debt recovery ratings.

Download Presentation

Please find below an Image/Link to download the presentation.
The content on the website is provided AS IS for your information and personal use only. It may not be sold, licensed, or shared on other websites without obtaining consent from the author.If you encounter any issues during the download, it is possible that the publisher has removed the file from their server.
You are allowed to download the files provided on this website for personal or commercial use, subject to the condition that they are used lawfully. All files are the property of their respective owners.
The content on the website is provided AS IS for your information and personal use only. It may not be sold, licensed, or shared on other websites without obtaining consent from the author.
E N D
Presentation Transcript
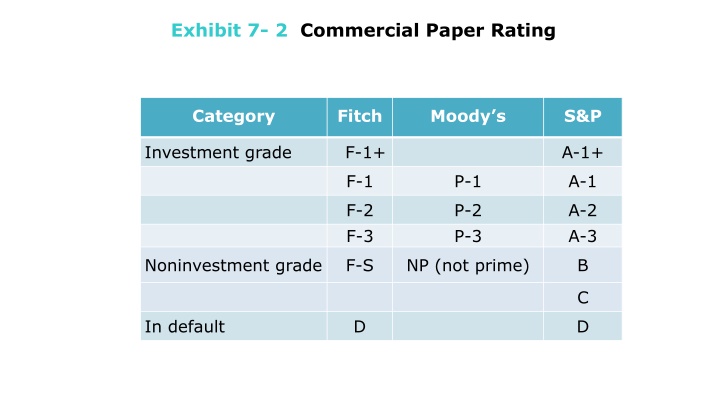
Exhibit 7- 2 Commercial Paper Rating Category Fitch Moody s S&P Investment grade F-1+ A-1+ F-1 P-1 A-1 F-2 F-3 P-2 P-3 A-2 A-3 Noninvestment grade F-S NP (not prime) B C In default D D
Exhibit 7-3 Simple, Typical CLO Capital Structure Percent of Capital Structure Bond Class Rating Coupon Class A 80% AAA LIBOR + 26 Class B 8% A LIBOR + 75 Class C 3% BBB LIBOR + 180 Class D 2% B LIBOR + 475 Equity Tranche 7% Not rated Residual Cash Flows
OLD Exhibit 7-4 Default Rates for High-Yield and Distressed Debt (Speculative Grade) Corporate Bonds: 1971 2009 Arithmetic Average Weighted Average Period Default Rate (Includes straight bonds only) Default Rate (Weighted by par value of amount outstanding for each year) 1971 2009 1978 2009 1985 2009 Fallen Angels Original-Issue Speculative Grade 3.33% 3.64% 4.32% 3.88% 4.55% 4.56% 4.60% 4.90%
OLD Exhibit 7-5 Average Dollar Recovery Per $100 Par Value by Seniority and Original Rating, Corporate Bond Defaults: 1971 2009 Investment Grade Noninvestment Grade Seniority All Senior secured $53.21 $43.83 $46.64 Senior Unsecured $43.69 $36.18 $39.95 Senior Subordinated $37.10 $32.74 $32.14 Subordinated $22.52 $32.54 $31.45
OLD Exhibit 7-6 Discounted Ultimate Recovery Rates by Debt Type Type of Debt/Seniority Average Recovery Rate Bank Loan 82% Senior Secured Debt 65% Senior Unsecured Debt 38% Senior Subordinated Debt 29% Subordinated Bond 27% Junior Subordinated Bond 15% All Bonds 37%
OLD Exhibit 7-7 S&P Recovery Ratings for Secured Debt Recovery Rate Ultimate Recovery of Principal Indicative Recovery Expectation Highest expectation of full recovery of principal High expectation of full recovery of principal 1+ 100% of principal 1 100% of principal 2 Substantial recovery of principal 80% 100% of principal 3 Meaningful recovery of principal 50% 80% of principal 4 Marginal recovery of principal 25% 50% of principal 5 Negligible recovery of principal 0% 25% of principal
OLD Exhibit 7-8 Fitch Rating Recovery Rating System Recovery Rating Recovery Prospect Recovery Band R1 R2 R3 R4 R5 R6 Outstanding Superior Good Average Below Poor 91% 100% 71% 90% 51% 70% 31% 50% 11% 30% 0% 10%
Exhibit 7-5 Hypothetical One-Year Rating Transition Matrix Rating at End of Year Rating at Start of Year Aaa Aa A Baa Ba B C or D Total Aaa 91.00 8.30 0.70 0.00 0.00 0.00 0.00 100.00 Aa 1.50 91.40 6.60 0.50 0.20 0.00 0.00 100.00 A 0.10 3.00 91.20 5.10 0.40 0.20 0.00 100.00 Baa 0.00 0.20 5.80 88.00 5.00 0.90 0.10 100.00