Financial Overview of Reductions and Contributions in the United States (2019-2023)
The data highlights reductions in the contributions of the United States from 2019 to 2023, along with the total quota income of other member states. It also includes projected expenses and budgetary reductions applied annually, categorized into personnel and non-personnel. The information provides insights into the financial aspects of the United States and other member states within the specified period.
Download Presentation

Please find below an Image/Link to download the presentation.
The content on the website is provided AS IS for your information and personal use only. It may not be sold, licensed, or shared on other websites without obtaining consent from the author.If you encounter any issues during the download, it is possible that the publisher has removed the file from their server.
You are allowed to download the files provided on this website for personal or commercial use, subject to the condition that they are used lawfully. All files are the property of their respective owners.
The content on the website is provided AS IS for your information and personal use only. It may not be sold, licensed, or shared on other websites without obtaining consent from the author.
E N D
Presentation Transcript
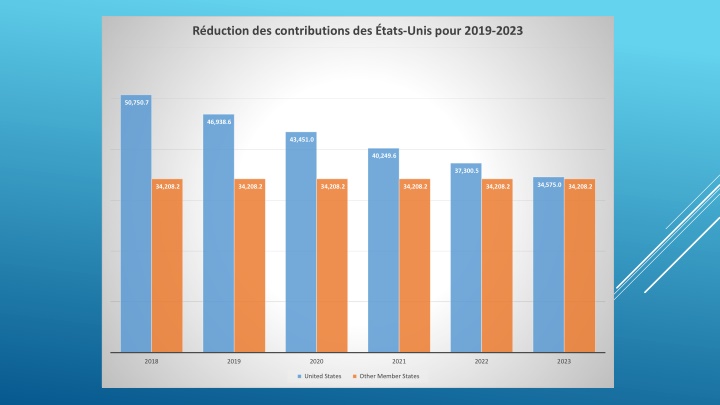
Rduction des contributions des tats-Unis pour 2019-2023 50,750.7 46,938.6 43,451.0 40,249.6 37,300.5 34,575.0 34,208.2 34,208.2 34,208.2 34,208.2 34,208.2 34,208.2 2018 2019 2020 2021 2022 2023 United States Other Member States
Revenu total des quotes-parts 2018-2023 85.0 81.1 77.7 74.5 71.5 68.8 50.8 46.9 43.5 40.2 37.3 34.6 34.2 34.2 34.2 34.2 34.2 34.2 2018 2019 2020 2021 2022 2023 Other Member States United States Total Quota Income
Ne comprend pas les cots dentretien diff r s ou d autres d penses n cessaires Revenus et d penses 2019 - 2023 (seules additions : IVC et Cancun) 90 85.7 85.5 85 81.3 80 77.4 76.0 74.2 75 72.8 71.3 69.9 70 67.1 65 60 55 50 2019 2020 2021 2022 2023 Total Expenses Projectd Income
Rductions budgtaires appliquer chaque exercice budgtaire 2019 - 2023 (Nombre d ETP entre parenth ses) 12.0 9.5 10.0 8.0 4.7 6.0 4.6 4.5 4.3 4.1 1.2 4.0 1.0 0.9 2.1 (34) 4.8 (24) 3.4 2.0 (22) 3.3 (21) 3.2 (18) 2.4 - 2019 2020 2021 2022 2023 Personnel Non-Personnel Total Reductions


