NYSTRS Financial Performance Overview 1998-2017
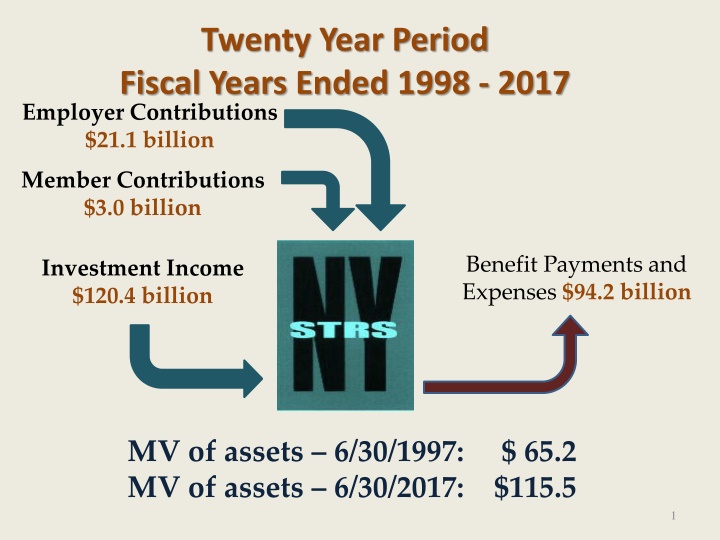
NYSTRS experienced significant growth over a twenty-year period, with employer contributions totaling $21.1 billion, member contributions at $3.0 billion, benefit payments and expenses reaching $94.2 billion, and investment income amounting to $120.4 billion. The breakdown of income sources reveals that 83% of income came from investment, 15% from employer contributions, and 2% from member contributions. The fund displayed a strong financial position with funded ratios based on market and actuarial values consistently above 90%. The investment performance history showed a 25-year annualized rate of return of 8.7%, despite facing challenges like the Great Recession which impacted asset values.

Download Presentation

Please find below an Image/Link to download the presentation.
The content on the website is provided AS IS for your information and personal use only. It may not be sold, licensed, or shared on other websites without obtaining consent from the author.If you encounter any issues during the download, it is possible that the publisher has removed the file from their server.
You are allowed to download the files provided on this website for personal or commercial use, subject to the condition that they are used lawfully. All files are the property of their respective owners.
The content on the website is provided AS IS for your information and personal use only. It may not be sold, licensed, or shared on other websites without obtaining consent from the author.
E N D
Presentation Transcript
Twenty Year Period Fiscal Years Ended 1998 - 2017 Employer Contributions $21.1 billion Member Contributions $3.0 billion Benefit Payments and Expenses $94.2 billion Investment Income $120.4 billion MV of assets 6/30/1997: $ 65.2 MV of assets 6/30/2017: $115.5 1
Breakdown of Income Sources Fiscal Years Ended 1998 - 2017 Investment Income (83%) Member Contributions (2%) Employer Contributions (15%) 2
Funded Ratio Funded Ratio Based on MVA 95.5% 100.8% 111.6% 104.1% 98.4% 99.8% Funded Ratio Based on AVA 89.8% 87.5% 92.9% 94.2% 97.9% 97.7% 6/30/12 6/30/13 6/30/14 6/30/15 6/30/16 6/30/17 Market Value of Assets (MVA): the value of fund assets as they would trade on an open market on that date Actuarial Value of Assets (AVA): the value of assets as used in the actuarial valuation which reflects a 5-year smoothing of investment gains and losses 3
NYSTRS Investment Performance History of Annual Returns Through June 30, 2017 30.0% 22.0% 25.0% 23.2% 20.0% 19.4% 18.2% 16.1% 12.5% 13.6% 15.0% 10.0% 6.8% 5.0% 2.8% 2.3% 1.8% 0.0% -5.0% -6.8% -10.0% -15.0% -20.0% -20.5% -25.0% 1993 1995 1997 1999 2001 2003 Fiscal Year Ending June 30 2005 2007 2009 2011 2013 2015 2017 25-year annualized rate of return: 8.7% 4
Great Recession Impact Market Value of Assets 9/30/2007 $106 B Market Value of Assets 06/30/2017 $115.5 B Market Value of Assets 3/31/2009 $68 B 5