Feasibility of Alternate Wetting and Drying as a GHG Mitigation Option in Rice Fields
This synthesis study explores the site-specific feasibility of alternate wetting and drying (AWD) as a greenhouse gas mitigation option in irrigated rice fields in Southeast Asia. The research analyzes the impact of environmental and soil properties on GHG mitigation, evaluates trade-offs and co-benefits of AWD in terms of rice grain yield and water savings, and compares measured site emission factors with IPCC default values. Inter-site variations in soil properties and AWD implementation criteria are also discussed, providing valuable insights for sustainable rice cultivation practices in the region.
Download Presentation

Please find below an Image/Link to download the presentation.
The content on the website is provided AS IS for your information and personal use only. It may not be sold, licensed, or shared on other websites without obtaining consent from the author.If you encounter any issues during the download, it is possible that the publisher has removed the file from their server.
You are allowed to download the files provided on this website for personal or commercial use, subject to the condition that they are used lawfully. All files are the property of their respective owners.
The content on the website is provided AS IS for your information and personal use only. It may not be sold, licensed, or shared on other websites without obtaining consent from the author.
E N D
Presentation Transcript
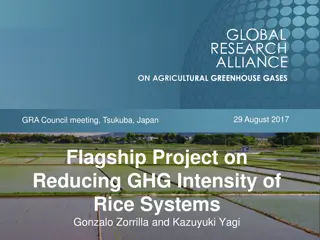
Site-specific feasibility of alternate wetting and drying as a greenhouse gas mitigation option in irrigated rice fields in Southeast Asia: a synthesis Agnes Tirol-Padre, Kazunori Minamikawa, Takeshi Tokida, Reiner Wassmann, and Kazuyuki Yagi
OBJECTIVES Analyze the effects of environment and soil properties on the extent of GHG mitigation by AWD Examine the potential trade-offs and co-benefits of AWD in terms of rice grain yield and water savings Compare the measured site Emission Factors and Scaling Factors for CH4and N2O under AWD, with the IPCC s default values
Inter-Site Variation in Soil Properties CLAYEY SOILS LOAMY SOILS Hue, Vietnam FAO: Ustic Epiaquert USDA: Eutric Vertisol Prachin Buri, Thailand USDA: Vertic Endoaquepts, Active, acid isohyperthermic sulfic Endoaquepts Jakenan, Indonesia USDA: Aeric Endoaquepts Mu oz, Philippines FAO: Dystric Fluvisols, USDA: Typic Endoaquepts
Inter-Site Variation in Soil Properties Site Hue Jakenan Prachin Buri Mu oz pH Total C (g kg-1) Total N (g kg-1) C:N mole ratio Active Fe (g kg-1) Active Mn (g kg-1) 4.18 19.2 1.90 11.9 12.3 0.03 6.46 5.3 0.47 13.3 3.6 0.05 4.93 6.44 14.6 1.23 14.6 12.6 0.68 22.2 1.80 14.5 15.6 0.07
Inter-Site Variation in AWD Implementation Criteria used: Minimum soil flood water level Total number of non-flooded days (ponding water less than 0 cm) from seeding to final drainage Ratio of number of non-flooded days to total crop duration (seeding to final drainage) Average water level 0.0103??? +0.0038????? ?? = 1.088
Inter-Site Variation in AWD Implementation Criteria Water Mgt Hue Jakenan Prachin Buri -12.5 (-15 to -4) -13.0 (-15 to -6) 24.3 (20 to 27) 13.3 (8 to 17) Mu oz DS -13.9 (-15 to -13) -133 (-19 to -7) 34 (24 to 45) 31.7 (12 to 50) Mu oz WS -9.5 (-12 to -6) -8.6 (-9 to -8) 10.5 (4 to 17) 6.0 (4 to 8) -18.3 (-25 to -8) -13.0 (-20 to -6) 30.2 (22 to 39) 29.3 (14 to 36) 0.94 0.28 -23.1 AWD Minimum water level (cm) (-46 to -11) -32.1 (-64 to -19) 30.7 (20 to 41) 27.2 (14 to 44) 1.85 0.28 0.78 0.29 AWDS No. of non- flooded days AWD AWDS 0.67 0.24 Drainability
Analyses of variance Source of Variation Grain yield Yield-scaled GWP Water use CH4 N2O GWP Site (S) Dry or Wet (DW) *** *** *** *** *** *** ** ns ** ns ** *** Water mgmt (WM) *** ns ** ns ns *** S DW WM S WM DW *** ns ns *** ns ns *** * ns *** ns ns *** ns *** *** ns WM DW S ns ns ns ns ns *
Changes under AWD relative to CF Site Season Hue Jakenan Prachin Buri -31.2 - -11.5 - -29.8 - Mu oz -25.8 -23.8 -30.8 -24.8 -14.4 -14.9 -36.7 -36.8 -36.3 -35.9 -6.4 -5.7 -32.1 14.1 -11.4 14.0 -47.1 -17.0 DS WS DS WS DS WS CH4 (%) GWP (kg CO2 eq ha-1) Water Use (m3 ha-1) Water Productivity (kg grain m-3 30.1 4.6 17.6 69.0 DS WS 25.6 3.3 - 22.2
CH4 Emission Factors and Scaling Factors for AWD Weighted means +/- bootstrapped confidence intervals Weighted means +/- bootstrapped confidence intervals
N2O Emission Factors EF was calculated by subtracting the mean background N2O emission from Akiyama et al., 2005
Inter-annual variation in soil carbon contents Soil depth: 0-20 cm Error bars: std deviation
Highlights CH4 emissions varied significantly (P<0.05) among sites, seasons and water management. N2O emissions were not significantly (P<0.05) affected by water management but considerable increases under AWD relative to CF were observed in Mu oz, and Prachin Buri during the DS. AWD successfully reduced the seasonal CH4 emission and GWP at varying levels: 25 and 28 % in Hue, 37 and 36 % in Jakenan, 31 and 11 % in Prachin Buri DS, and 32 and 11 % in Mu oz DS.
Highlights AWD was not effective in the clayey soils of Mu oz and Prachin Buri during WS due to the frequent rainfall & the slow water percolation; but it was effective during WS and DS in Hue and Jakenan, both of which had loamy soils and relatively faster percolation rates. The acid sulfate soil primarily contributed to low CH4 emissions in Prachin Buri High soil Mn content may have contributed to the low CH4 emissions during DS in Mu oz
Highlights AWD effectively reduced water use compared to continuous flooding (CF) but did not significantly (P < 0.05) reduce rice grain yield (even with the more drastic AWD in Hue and Jakenan) and soil carbon content in the top soil in all sites. The reduction in water use through AWD relative to CF was remarkably higher in the clayey soils of Mu oz during DS (47%) and Prachin Buri DS (30%) than in the loamy soils of Hue (15%) and Jakenan (6%). High water savings through AWD do not always translate to high CH4 emission reduction due to a greater influence of soil properties.
Highlights The weighted mean CH4-EF for CF and AWD in Hue and Jakenan were significantly higher than those in Mu oz DS and Prachin Buri. The weighted-mean CH4-EF under CF across sites and seasons including Mu oz WS (2.46 0.56 kg ha-1 d-1) was higher although not significantly different from the IPCC s default EF for flooded rice (1.30 kg ha-1 d-1) partly because they were obtained under site-specific management practices e.g. incorporation of FYM in Jakenan.
Highlights The ratio of seasonal cumulative N2O-N emission to the inorganic fertilizer N applied across sites was 0.42% under CF and 0.49% under AWD, comparable to those reported by Akiyama et al. (0.38 0.41% under CF and 0.67 0.22% under midseason drainage). The AWD SF obtained for CH4 did not significantly differ among sites, with a weighted mean of 0.69 ranging from 0.57 to 0.84 (excluding Mu oz WS). This was slightly higher but not significantly different from the IPCC s default SF for multiple aeration of 0.52
Highlights Using data from Hue and Jakenan, multiple regression analysis with stepwise selection showed that Minimum Water Level (MinWL) and Number of Non-flooded Days (NNFD) significantly influenced the variability in AWD SFs accounting for 41% of total variability. Based on predicted SFs, a 30% reduction (SF=0.70) in CH4 emission can be achieved with NNFD 32 when the MinWL = -15 cm for the loamy soils of Hue and Jakenan.
Thank you very much for your attention !!!
