Exploring Viral Spread Through Mathematical Modeling
Guide providing insights into viral transmission and exponential growth through a mathematical model programmed in Google Sheets. Students explore the impact of reproduction numbers (R0) on viral spread and strategies for reducing transmission. The resource includes instructional strategies, discussion prompts, and links to related activities and readings, enhancing students' understanding of viral spread in societal contexts.
Download Presentation

Please find below an Image/Link to download the presentation.
The content on the website is provided AS IS for your information and personal use only. It may not be sold, licensed, or shared on other websites without obtaining consent from the author.If you encounter any issues during the download, it is possible that the publisher has removed the file from their server.
You are allowed to download the files provided on this website for personal or commercial use, subject to the condition that they are used lawfully. All files are the property of their respective owners.
The content on the website is provided AS IS for your information and personal use only. It may not be sold, licensed, or shared on other websites without obtaining consent from the author.
E N D
Presentation Transcript
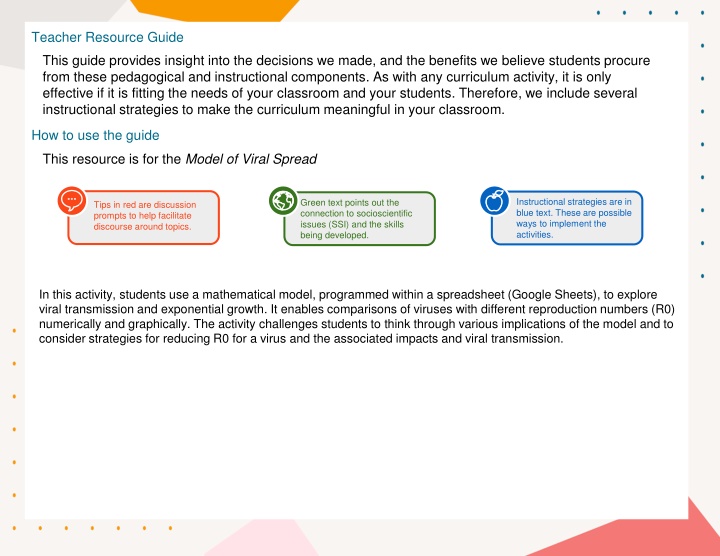
Teacher Resource Guide This guide provides insight into the decisions we made, and the benefits we believe students procure from these pedagogical and instructional components. As with any curriculum activity, it is only effective if it is fitting the needs of your classroom and your students. Therefore, we include several instructional strategies to make the curriculum meaningful in your classroom. How to use the guide This resource is for the Model of Viral Spread Instructional strategies are in blue text. These are possible ways to implement the activities. Green text points out the connection to socioscientific issues (SSI) and the skills being developed. Tips in red are discussion prompts to help facilitate discourse around topics. In this activity, students use a mathematical model, programmed within a spreadsheet (Google Sheets), to explore viral transmission and exponential growth. It enables comparisons of viruses with different reproduction numbers (R0) numerically and graphically. The activity challenges students to think through various implications of the model and to consider strategies for reducing R0 for a virus and the associated impacts and viral transmission.
R0 (pronounced R naught) is a symbol used to represent the reproduction number. The reproduction number describes how many people, on average, are infected by an individual with the virus. In this figure R0=2, meaning that every one person infected, infects two more. Discussion - Why does Covid-19 spread so quickly? This graphic demonstrates how a reproduction number or R0 (pronounced naught) of 2 spreads exponentially. The R0 of COVID-19 is between 1.5-3 and can spread even faster than this example. This activity uses similar modeling concepts to the "Math Behind Masks" extension activity. This viral modeling activity can provides an introduction to viral spread and the mask activity reinforces and expands on those ideas. Maybe add something here? Additional helpful reading for students: https://theconversation.com/r0-how- scientists-quantify-the-intensity-of-an- outbreak-like-coronavirus-and-predict- the-pandemics-spread-130777
This activity requires access to Google Sheets You can use the model to make predictions about the spread of different viruses with unique rates of spread by changing the reproduction number. The R0 values for different viruses such as Ebola can be found in the additional reading the article. Students gain an understanding about how scientific knowledge relates to larger social contexts such as Covid-19 through modeling.
How to use this model: You will need to input three variables: (1) the number of infected individuals you choose to start with (2) R0 (3) How many rounds of transmission you want to model. Rounds of transmission means how many steps in the outbreak you want to model. For example, for a virus with R0=3, one person infecting three people, and then those three people infecting three more each (for a total of nine) would represent 2 rounds of transmission. The model will automatically show 10 rounds of transmission, and you can select a higher number of rounds. The model is programmed so that you can use it to compare different viruses, different estimates of R0, or different numbers of people initially infected. You can run the model for one situation or two situations to show a comparison. Add numbers for the numbers initially infected, R0, and rounds of infection in the boxes below and the model will provide estimates of the numbers of individuals predicted to become infected. The graph (at the bottom) will be created when you input information into the model. In the example to the right, our variables are: (1) 3 individuals initially infected (2) R0=2 (3) 5 rounds of transmission This presents a mathematical model of the spread of a virus through a human population. Like other models that are used by scientists, this model uses data to help describe a phenomenon (in this case the spread of a virus). You can use the model to make predictions about the spread of different viruses with unique rates of spread.
Question 1 1a) The reproduction number (R0) for COVID-19 may be as low as 1.5 or as high as 3.5. How many people would we expect to be infected after 5 rounds of transmission if the low R0 is accurate? If you start with 1 infected person, after 5 rounds of transmission about 8 people will be infected. 1b) How many people would we expect to be infected after 5 rounds of transmission if the high R0 is accurate? If you start with 1 infected person, after 5 rounds of transmission about 525 people will be infected. 1c) Why does the accuracy of the R0 value matter? Answers may vary. One possible answer: Because each round of transmission is exponential, a small change in R0 results in a large difference in the number of infected people. 1d) Why do you think there is such a big range for the R0 value for COVID-19 at this point in time? Answers may vary. One possible answer: We are still learning more about the spread of Covid-19. There are a number of additional factors that could impact the rate of transmission such as social distancing and wearing masks.
Flu COVID-19 Question 2 2a) R0 for the common flu is estimated at 1.3. If we assume R0 for COVID-19 is 3, how many more people can we expect to be infected by COVID-19 compared to the flu after 10 rounds of transmission? Assuming you start with 1 infected, the common flu would infect 14 people total. Covid-19 would infect 59,049. About 59,035 more would be infected by Covid-19. 2b) How many rounds of transmission of the flu would it take for flu to infect the number of people infected by COVID-19 after 10 rounds of transmission? About 42 rounds of transmission. 2c) What factors might contribute to the low rate of viral transmission of the flu compared to COVID-19? Answers may vary. One possible answer: More people already have antibody immunity to the common flu. 2d) If you had to calculate the number infected after 3 rounds of transmission by hand (without the use of the model), explain how you would make the calculation. First round: You multiply the initial number of infected by the R0. Second round: You multiply the total infected from the first round by the R0. Third round: You multiple the total infected from the second round by R0. Students use model data to reason about how social factors influence the spread COVID-19
Question 3 Modeling can help students translate knowledge to new scenarios such as other viral epidemics 3a) This model helps us to think about the spread of disease and can help us to compare the rate of spread of different viruses. What other aspects of different viruses should we consider when comparing the "intensity" of viral outbreaks? Answer may vary. Possible answers: virus mutations, replication rate of viruses in the body, how viruses enter the body. Other researchers have developed a COVID-19 activity about contact tracing, which could be a useful extension activity related to viral modeling. Follow this link for more information about their resource: https://docs.google.com/presentation/d/ 1gIcHloWAOYjahmEHXwbxPEZIAib9f L7eXiFRIHPfpJw/edit#slide=id.g93142 178d2_0_24 3b) What are limitations of this model? Answers may vary. Possible answers: the model does not factor in social distancing or other efforts to slow the spread, the model is an estimation, the model cannot represent any changes in R0 overtime.
Question 4 4a) What happens to a viral outbreak when R0 for the virus fall below 1? The rate of transmission will be decrease instead of increase. 4b) What things could be done to lower the COVID-19 R0? Answers may very. Possible answers: hand washing, wearing masks, social distancing, quarantining. 4c) If we assume that 100,000 individuals are infected by COVID-19 but we were able to drive its R0 down to 0.2, how long (in rounds of transmission) would it take to halt the spread of the virus? 8 rounds. Students apply their knowledge to take positions on actions that could lower the spread of COVID-19. Engagement in multiple scientific models promotes students understanding about the phenomena relevant to the focal issue. Engagement in socio-scientific models helps students to use that scientific knowledge in the larger social contexts and reason about how interacting science and social factors may impact students positions on the complex issue.
