Exploring Population Trends from 1851 to 1911 in England and Wales
The PopulationsPast website by researchers from the University of Cambridge offers insights into Victorian and Edwardian life through census data from 1851 to 1911. It covers population density, infant mortality rates, average age, and more. The data reveals significant changes in demographics and societal conditions over this period.
Download Presentation

Please find below an Image/Link to download the presentation.
The content on the website is provided AS IS for your information and personal use only. It may not be sold, licensed, or shared on other websites without obtaining consent from the author. Download presentation by click this link. If you encounter any issues during the download, it is possible that the publisher has removed the file from their server.
E N D
Presentation Transcript
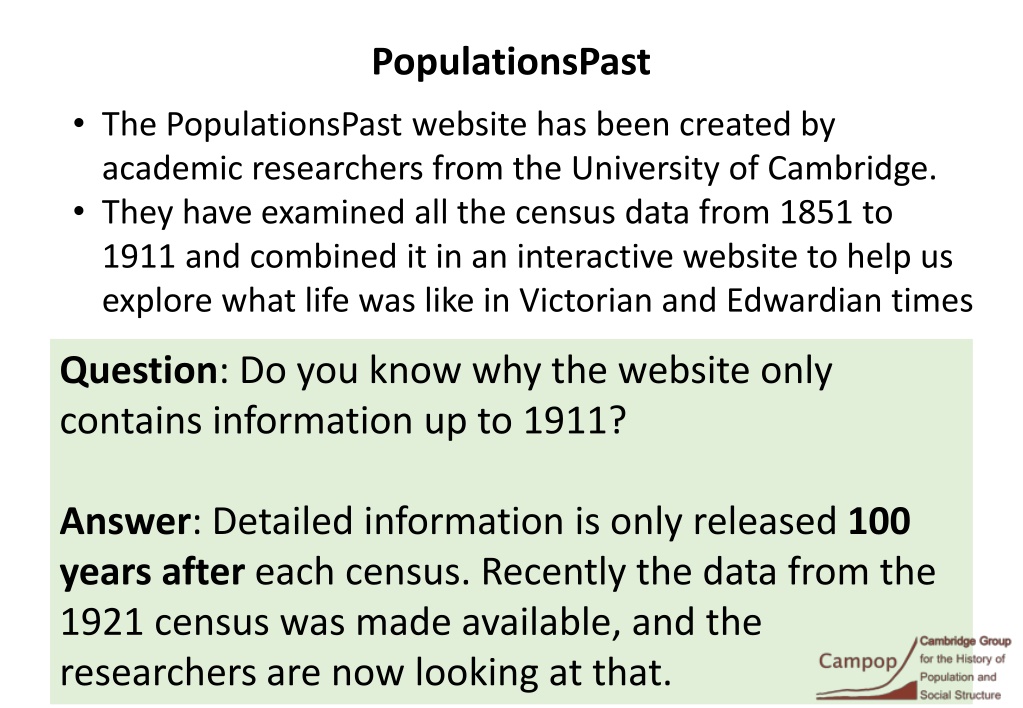
PopulationsPast The PopulationsPast website has been created by academic researchers from the University of Cambridge. They have examined all the census data from 1851 to 1911 and combined it in an interactive website to help us explore what life was like in Victorian and Edwardian times Question: Do you know why the website only contains information up to 1911? Answer: Detailed information is only released 100 years after each census. Recently the data from the 1921 census was made available, and the researchers are now looking at that.
Population Statistics Based on the answers people gave to the census questions in 1851 to 1911, we can look at some population statistics, including: Population density Infant mortality rate Average age Total fertility rate Number of children per teacher And we can explore how these change over time.
Population Statistics Population density The number of people in an acre (an acre is about the size of 16 tennis courts) Towns and cities are generally more densely populated than rural areas. Between 1851 and 1911 the population of England and Wales more than doubled, rising from just under 18 million to just over 36 million. However, the additional people were not spread evenly across the country, as population increase was accompanied by rapid urbanisation.
Population Statistics Infant mortality rate The number of children who died before their first birthday out of each 1,000 children born The infant mortality rate was around 150 per thousand for England and Wales, and around 120 per thousand for Scotland, across the second half of the nineteenth century. There was considerable variation across Britain. Higher urban infant mortality has been attributed to crowded populations living in insanitary conditions, favouring the spread of infectious diseases.
Population Statistics Average age The mean age of the population in the area Between 1851 and 1881 the average age in Britain was just under 25 years, and the sharp increase that followed was mainly due to the decline in fertility after 1881, reducing the number of children in relation to the rest of the population. There were regional variations in average age, with mining areas having the lowest average age and professional areas the highest. Average age differences were also affected by migration.
Population Statistics The average number of children a woman gives birth to between her 20th birthday and her 50th birthday In the mid-19th century, women in Britain had around 4.5 children each, although there was considerable geographic variation, with higher fertility in the mining areas of the North-East of England and parts of Scotland, and particularly low fertility in the West End of London and much of the Scottish Highlands. Fertility rate By 1911 the national rate had fallen by a third, and women were having an average of three children each.
Population Statistics Number of children per teacher The number of children aged 4 to 13 years for every teacher In 1851 there were over 60 children for every teacher in England and Wales, but by the end of the century there were only around half as many children per teacher. This statistic reflects improvements in educational provision. The 1880 Education Act made school compulsory for children between the ages of 5 and 10 years. However, it is likely that not all children attended school until the Elementary Education Act of 1891 effectively introduced free education.
