Exploring Metric Quiz and Percent Error Calculation
In this study guide, explore Factor Label notes, Metric Quiz preparation with Factor Label problems, and practice on percent error calculation. Understand the concepts of accuracy and precision in data collection for laboratory investigations.
Download Presentation

Please find below an Image/Link to download the presentation.
The content on the website is provided AS IS for your information and personal use only. It may not be sold, licensed, or shared on other websites without obtaining consent from the author.If you encounter any issues during the download, it is possible that the publisher has removed the file from their server.
You are allowed to download the files provided on this website for personal or commercial use, subject to the condition that they are used lawfully. All files are the property of their respective owners.
The content on the website is provided AS IS for your information and personal use only. It may not be sold, licensed, or shared on other websites without obtaining consent from the author.
E N D
Presentation Transcript
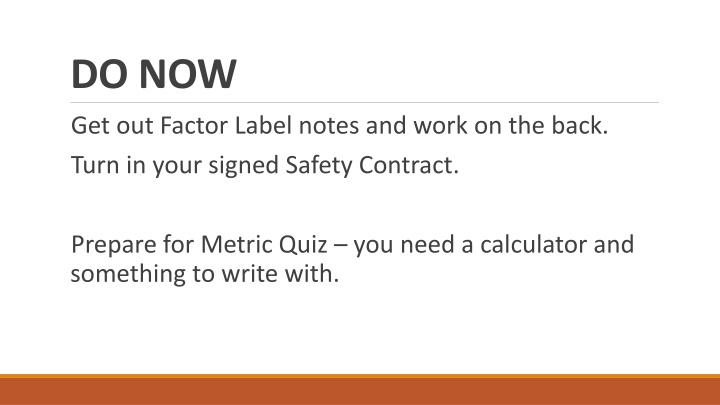
DO NOW Get out Factor Label notes and work on the back. Turn in your signed Safety Contract. Prepare for Metric Quiz you need a calculator and something to write with.
FACTOR LABEL 1. kilo-, hecto-, deka-, deci-, centi-, milli- 2. 5mm 1 dam = 0.0005dam 35cm 1 km = 0.00035km 10000mm 100000cm 0.12m 100cm = 12cm 1m 19km 10000dm = 190000dm 1km 0.4m 10hm = 4hm 1m
METRIC QUIZ Write on the quiz. Be sure to show work for the two Factor Label problems (#5 and #6) Turn it in when completed and sit SILENTLY until all are finished.
PERCENT ERROR, ACCURACY, AND PRECISION Or how to tell if you are any good at data collection
PERCENT ERROR Calculation of percent error is one way to make a distinction between an observed value and a true or literature value. Percent error can be used to describe the accuracy of results of laboratory investigations if a generally accepted (true or literature value) is known. Percent error is always positive. Take the absolute value. % error = [observed value - true/literature value] x 100 true/literature value
PRACTICE 1. The density of mercury is known to be 13.8 g/cm3. Results of an experiment give that density to be 14.2 g/cm3. Calculate the percent error.
PRACTICE 2. The volume of a rectangular solid is known to be 556 cm3. A student takes the following measurements for the dimensions of the rectangular solid: 8.34 cm 6.19 cm 10.42 cm a. What volume is calculated for the rectangular solid from these measurements? b. What is the percent error of these results?
ACCURACY AND PRECISION When taking measurements during a lab, you may need to know if your data is reliable. There are two ways to check reliability. Precision: One way is to repeat the measurement several times. A reliable result will give the same measurement time after time. This is how close a set of measurements for a quantity are to each other, but still can be regardless of correctness. Accuracy: This is how close a measurement is to the correct (standard, literature) value for the quantity.
http://saturn.cis.rit.edu/~dxl1840/data/uploads/accuracyprecision.gifhttp://saturn.cis.rit.edu/~dxl1840/data/uploads/accuracyprecision.gif
PRACTICE Two students massed the same sample on two different laboratory balances. The results were as follows: Balance A 12.11 g 12.09 g 12.1324 g 12.1322 g Balance B Which balance is more precise? If the mass of the sample is actually 12.1 g, which is more accurate?
ACTIVITY 1. Estimate the length of the coffee stirrer. Write it down. 2. FIRST RULER: measure the length of the coffee stirrer. Record the length 3. SECOND RULER: measure the length of the coffee stirrer. Record the length 4. THIRD RULER: measure the length of the coffee stirrer. Record the length Explain why RULER #3 is more accurate than RULER #1.
SIGNIFICANT FIGURES Helps to determine the exactness of measurements. The last place in a number is the inexact number all others have been measured with certainty. There are several levels: Determining the # of significant figures in a number. Determining the # of significant figures in a calculation.
MEASURING SIGNIFICANTLY Michael Phelps Justin Gatlin
SIGNIFICANT FIGURES SIGNIFICANT FIGURES ATLANTIC-PACIFIC RULE This rule divides measurements into two kinds those with a decimal point and those without. http://www.yourchildlearns.com/images/map-of-united-states.gif If a decimal point is present in the number, count significant digits from the Pacific side. (If decimal point is present, count from the Pacific side.) If a decimal point is absent, count from the Atlantic side. You should start counting with the first nonzero digit you find. Thereafter, all digits, including zero, are significant.
SIGNIFICANT FIGURES ANOTHER WAY 1. Digits other than zero are always significant. 2. One or more final zeros used after the decimal point are always significant. 3. Zeros between two other significant digits are always significant. 4. Zeros used solely for spacing the decimal point are not significant. The zeros are place holders only.
SIGNIFICANT FIGURES Infinite amount of significant figures: Counting numbers (23 cockroaches, 3 cars, 5 ice cream cones) Defined constants or conversions (like 1km = 1000m)
PRACTICE Calculate the number of significant figures in the following measurements. 1. 45.601 g _______ 2. 0.00701 m _______ 3. 75,000 km _______ 4. 0.2460 mg _______ 5. 78,621.0 mL _______ 6. 4.567 m _______ 7. 23 desks _______ 8. 2.010L _______ 9. 0.002m _______
DO NOW Do Percent Error, Accuracy, and Precision Practice for tomorrow.
