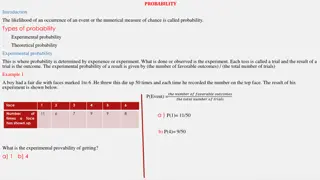
Experimental Probability Through Teacher's Pen Throws
Explore the concept of experimental probability through a teacher's pen-throwing experiment. Learn how to calculate successful throws based on relative frequency and practice different scenarios. The visuals provided enhance comprehension of this fundamental probability concept.

Download Presentation

Please find below an Image/Link to download the presentation.
The content on the website is provided AS IS for your information and personal use only. It may not be sold, licensed, or shared on other websites without obtaining consent from the author.If you encounter any issues during the download, it is possible that the publisher has removed the file from their server.
You are allowed to download the files provided on this website for personal or commercial use, subject to the condition that they are used lawfully. All files are the property of their respective owners.
The content on the website is provided AS IS for your information and personal use only. It may not be sold, licensed, or shared on other websites without obtaining consent from the author.
E N D
Presentation Transcript
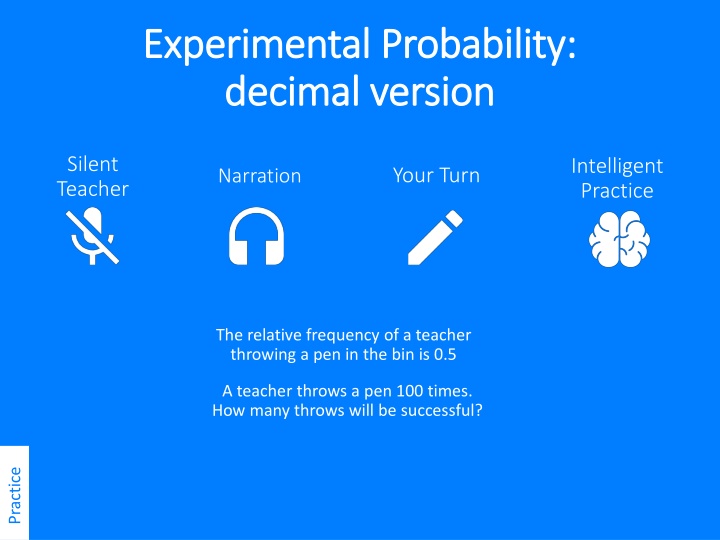
Experimental Probability: Experimental Probability: decimal version decimal version Silent Teacher Intelligent Practice Your Turn Narration The relative frequency of a teacher throwing a pen in the bin is 0.5 A teacher throws a pen 100 times. How many throws will be successful? Practice
Worked Example Your Turn The relative frequency of a teacher throwing a pen in the bin is 0.5 The relative frequency of a teacher throwing a pen in the bin is 0.5 A teacher throws a pen 100 times. How many throws will be successful? A teacher throws a pen 1000 times. How many throws will be successful? ??????????? ?????? ?? ?????? 0.5 100 = 50 ?????
The relative frequency of a teacher throwing a pen in the bin is 0.5. A teacher throws a pen 50 times. How many will be successful? 1. 2. The relative frequency of a teacher throwing a pen in the bin is 0.1. A teacher throws a pen 50 times. How many will be successful? The relative frequency of a teacher throwing a pen in the bin is 1. A teacher throws a pen 50 times. How many will be successful? 3. 4. The relative frequency of a teacher throwing a pen in the bin is 0.9. A teacher throws a pen 100 times. How many will be successful? 5. The relative frequency of a teacher throwing a pen in the bin is 0.10. A teacher throws a pen 100 times. How many will be successful? 6. The relative frequency of a teacher throwing a pen in the bin is 0.15. A teacher throws a pen 100 times. How many will be successful? The relative frequency of a teacher throwing a pen in the bin is 0.015. A teacher throws a pen 100 times. How many will be successful? 7.
The relative frequency of a teacher throwing a pen in the bin is 0.5. A teacher throws a pen 50 times. How many will be successful? 1. = 25 ????? 2. The relative frequency of a teacher throwing a pen in the bin is 0.1. A teacher throws a pen 50 times. How many will be successful? = 5 ????? The relative frequency of a teacher throwing a pen in the bin is 1. A teacher throws a pen 50 times. How many will be successful? 3. = 50 ????? 4. The relative frequency of a teacher throwing a pen in the bin is 0.9. A teacher throws a pen 100 times. How many will be successful? = 90 ????? 5. The relative frequency of a teacher throwing a pen in the bin is 0.10. A teacher throws a pen 100 times. How many will be successful? = 10 ????? 6. The relative frequency of a teacher throwing a pen in the bin is 0.15. A teacher throws a pen 100 times. How many will be successful? = 15 ????? The relative frequency of a teacher throwing a pen in the bin is 0.015. A teacher throws a pen 100 times. How many will be successful? 7. = 1.5 ?????