Ethnic Disparities in Various Aspects of Society


Race Disparity Unit
Richard Laux and V
asileios Antonopoulos
ethnicity-facts-and-figures.service.gov.uk


Race Disparity Unit
ethnicity-facts-and-figures.service.gov.uk
Race Disparity Unit
ethnicity-facts-and-figures.service.gov.uk
Seeing the bigger picture
●
176 measures
about different
aspects of crime & justice,
education, health, housing,
and work & pay
●
Summary reports - topics, and
ethnic groups
Race Disparity Unit
ethnicity-facts-and-figures.service.gov.uk
The problem with averages
●
National figures are averages - of
every part of the country.
●
Often it’s the parts of the country
that are most interesting.
●
Attainment 8 - all children:
○
England
46.5
○
Bristol
45.5
●
Attainment 8 - Black children
○
England
45.3
○
Bristol
40.6
Race Disparity Unit
ethnicity-facts-and-figures.service.gov.uk
Why focus on ‘the local’?
●
To identify areas which
might benefit from
particular
interventions/changes
●
To identify areas with
different outcomes -
possible examples of good
practice
Race Disparity Unit
ethnicity-facts-and-figures.service.gov.uk
Panning for gold
●
National figures are averages - of men and
women, of people from each ethnic group,
of different ages …
●
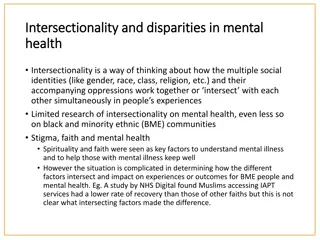
Common Mental Disorder
rates are higher
for Black women than White women
●
CMD rates are higher for women than men
in all ethnic groups - the gender split is vital
Race Disparity Unit
ethnicity-facts-and-figures.service.gov.uk
More gold
●
National figures are
averages …
●
Employment rate
- higher
for men than women, of all
ethnicities
●
Gender employment rate
gap is highest for the
combined Pakistani and
Bangladeshi group - the
detailed ethnicity split is
vital
Race Disparity Unit
ethnicity-facts-and-figures.service.gov.uk
You can’t have too much of a good
thing
●
Reliable and useful estimates require
masses of data:
○
Rare phenomena
○
Sample survey data
○
Ethnicity x gender x age
}
strain
○
18+1 preferred to 5+1
} “
D
A
T
A
,
D
A
T
A
E
V
E
R
Y
W
H
E
R
E
Race Disparity Unit
ethnicity-facts-and-figures.service.gov.uk
A cunning plan?
●
Data collection is expensive
●
Combine survey data for 2-
3 years
●
Data linkage?
●
Statistical reports on
specific areas?
●
2021 Census
●
Transparency:
○
Geography
dashboard
Spotlight: Bristol
QA
Race Disparity Unit
ethnicity-facts-and-figures.service.gov.uk
Changes in Bristol population
●
Between 2001 and 2011
the Ethnic minority
population in Bristol
increased from 8% to 16%
●
The largest increases by
ethnic group since 2001
have been in Black ethnic
groups. This change
reflects the large growth in
the Somali population in
Bristol.
Source: Census 2001 and 2011
Race Disparity Unit
ethnicity-facts-and-figures.service.gov.uk
Bristol population by age group
●
The age profile of the ethnic
minority population is much
younger than the age profile
of the Bristol population as a
whole.
●
This reflects the increase in
international students and
the increasingly mixed child
population
Source:Census 2011
Race Disparity Unit
ethnicity-facts-and-figures.service.gov.uk
Population across the city
●
Since 2001, the distribution of the
ethnic minority population of Bristol
considerably
changed. Whilst in 2001
the BME population largely lived in
inner city wards, in 2011 the
distribution of the ethnic minority
population extended to the north east
of the city.
●
Lawrence Hill, Easton, Eastville and
Hilfields have a high ethnic minority
population and are in the most
deprived 10% of areas in England
Source: Census 2001 and 2011
Race Disparity Unit
ethnicity-facts-and-figures.service.gov.uk
●
Chinese pupils in Bristol had the highest average Progress 8 score
●
White and Black boys in Bristol made less progress than the national average
●
All other ethnic groups made less progress between the ages of 11 and 16 in Bristol
compared to the national average of average progress 8 scores
Source: Department for
Education
Education
Race Disparity Unit
ethnicity-facts-and-figures.service.gov.uk
Employment
●
The employment rate in Bristol was higher than that in Great Britain, at 77.1% compared with 75% in
2018.
●
The employment rate for ethnic minority groups excluding White minorities was 65.7%, which was
slightly higher than the average for England, Scotland and Wales of 65.3%.
Source: Annual Population
Survey
Race Disparity Unit
ethnicity-facts-and-figures.service.gov.uk
Workforce
Proportion of ethnic minorities staff employed by public sector in Bristol, 2018
Source: Bristol City Council and Race Disparity Unit
Thank you.
Any questions?
Race Disparity Unit
Find out more and get involved:
https://www.ethnicity-facts-figures.service.gov.uk/
ethnicity@cabinetoffice.gov.uk
#racedisparityaudit
Sign-up to our monthly
Ethnicity Facts and Figures
newsletter
ethnicity-facts-and-figures.service.gov.uk
This content delves into the racial disparities in crime, justice, education, health, housing, and employment. It emphasizes the importance of looking beyond national averages to understand the nuanced challenges faced by different ethnic groups in society. The visuals presented highlight varying outcomes in different areas and stress the significance of local interventions to address these disparities effectively.

Download Presentation

Please find below an Image/Link to download the presentation.
The content on the website is provided AS IS for your information and personal use only. It may not be sold, licensed, or shared on other websites without obtaining consent from the author.If you encounter any issues during the download, it is possible that the publisher has removed the file from their server.
You are allowed to download the files provided on this website for personal or commercial use, subject to the condition that they are used lawfully. All files are the property of their respective owners.
The content on the website is provided AS IS for your information and personal use only. It may not be sold, licensed, or shared on other websites without obtaining consent from the author.
E N D
Presentation Transcript
Race Disparity Unit Richard Laux and Vasileios Antonopoulos ethnicity-facts-and-figures.service.gov.uk Race Disparity Unit ethnicity-facts-and-figures.service.gov.uk
Seeing the bigger picture 176 measures about different aspects of crime & justice, education, health, housing, and work & pay Summary reports - topics, and ethnic groups Race Disparity Unit ethnicity-facts-and-figures.service.gov.uk
The problem with averages National figures are averages - of every part of the country. Often it s the parts of the country that are most interesting. Attainment 8 - all children: England 46.5 Bristol 45.5 Attainment 8 - Black children England 45.3 Bristol 40.6 Race Disparity Unit ethnicity-facts-and-figures.service.gov.uk
Why focus on the local? To identify areas which might benefit from particular interventions/changes To identify areas with different outcomes - possible examples of good practice Race Disparity Unit ethnicity-facts-and-figures.service.gov.uk
Panning for gold National figures are averages - of men and women, of people from each ethnic group, of different ages Common Mental Disorder rates are higher for Black women than White women CMD rates are higher for women than men in all ethnic groups - the gender split is vital Race Disparity Unit ethnicity-facts-and-figures.service.gov.uk
More gold National figures are averages Employment rate - higher for men than women, of all ethnicities Gender employment rate gap is highest for the combined Pakistani and Bangladeshi group - the detailed ethnicity split is vital Race Disparity Unit ethnicity-facts-and-figures.service.gov.uk
You cant have too much of a good thing DATA, DATA EVERYWHERE Reliable and useful estimates require masses of data: Rare phenomena Sample survey data Ethnicity x gender x age strain 18+1 preferred to 5+1 } } Race Disparity Unit ethnicity-facts-and-figures.service.gov.uk
A cunning plan? Data collection is expensive Combine survey data for 2- 3 years Data linkage? Statistical reports on specific areas? 2021 Census Transparency: Geography dashboard Race Disparity Unit ethnicity-facts-and-figures.service.gov.uk
Changes in Bristol population Between 2001 and 2011 the Ethnic minority population in Bristol increased from 8% to 16% The largest increases by ethnic group since 2001 have been in Black ethnic groups. This change reflects the large growth in the Somali population in Bristol. Source: Census 2001 and 2011 Race Disparity Unit ethnicity-facts-and-figures.service.gov.uk
Bristol population by age group The age profile of the ethnic minority population is much younger than the age profile of the Bristol population as a whole. This reflects the increase in international students and the increasingly mixed child population Source:Census 2011 Race Disparity Unit ethnicity-facts-and-figures.service.gov.uk
Population across the city Since 2001, the distribution of the ethnic minority population of Bristol considerably changed. Whilst in 2001 the BME population largely lived in inner city wards, in 2011 the distribution of the ethnic minority population extended to the north east of the city. Lawrence Hill, Easton, Eastville and Hilfields have a high ethnic minority population and are in the most deprived 10% of areas in England Source: Census 2001 and 2011 Race Disparity Unit ethnicity-facts-and-figures.service.gov.uk
Education Source: Department for Education Chinese pupils in Bristol had the highest average Progress 8 score White and Black boys in Bristol made less progress than the national average All other ethnic groups made less progress between the ages of 11 and 16 in Bristol compared to the national average of average progress 8 scores Race Disparity Unit ethnicity-facts-and-figures.service.gov.uk
Employment Source: Annual Population Survey The employment rate in Bristol was higher than that in Great Britain, at 77.1% compared with 75% in 2018. The employment rate for ethnic minority groups excluding White minorities was 65.7%, which was slightly higher than the average for England, Scotland and Wales of 65.3%. Race Disparity Unit ethnicity-facts-and-figures.service.gov.uk
Workforce Proportion of ethnic minorities staff employed by public sector in Bristol, 2018 Source: Bristol City Council and Race Disparity Unit Race Disparity Unit ethnicity-facts-and-figures.service.gov.uk
Thank you. Any questions?
Find out more and get involved: https://www.ethnicity-facts-figures.service.gov.uk/ ethnicity@cabinetoffice.gov.uk #racedisparityaudit Sign-up to our monthly Ethnicity Facts and Figures newsletter Race Disparity Unit ethnicity-facts-and-figures.service.gov.uk