Estimation and Implementation Guidance for 3DIC Benefits
Explore the benefits and challenges of 3DIC implementation, including the estimation of power reduction benefits and the need for accurate power estimation tools. Learn about the upper bounds on wirelength reduction and the tight integration of 3D power benefit estimation tools to enhance implementation strategies.
Download Presentation

Please find below an Image/Link to download the presentation.
The content on the website is provided AS IS for your information and personal use only. It may not be sold, licensed, or shared on other websites without obtaining consent from the author. If you encounter any issues during the download, it is possible that the publisher has removed the file from their server.
You are allowed to download the files provided on this website for personal or commercial use, subject to the condition that they are used lawfully. All files are the property of their respective owners.
The content on the website is provided AS IS for your information and personal use only. It may not be sold, licensed, or shared on other websites without obtaining consent from the author.
E N D
Presentation Transcript
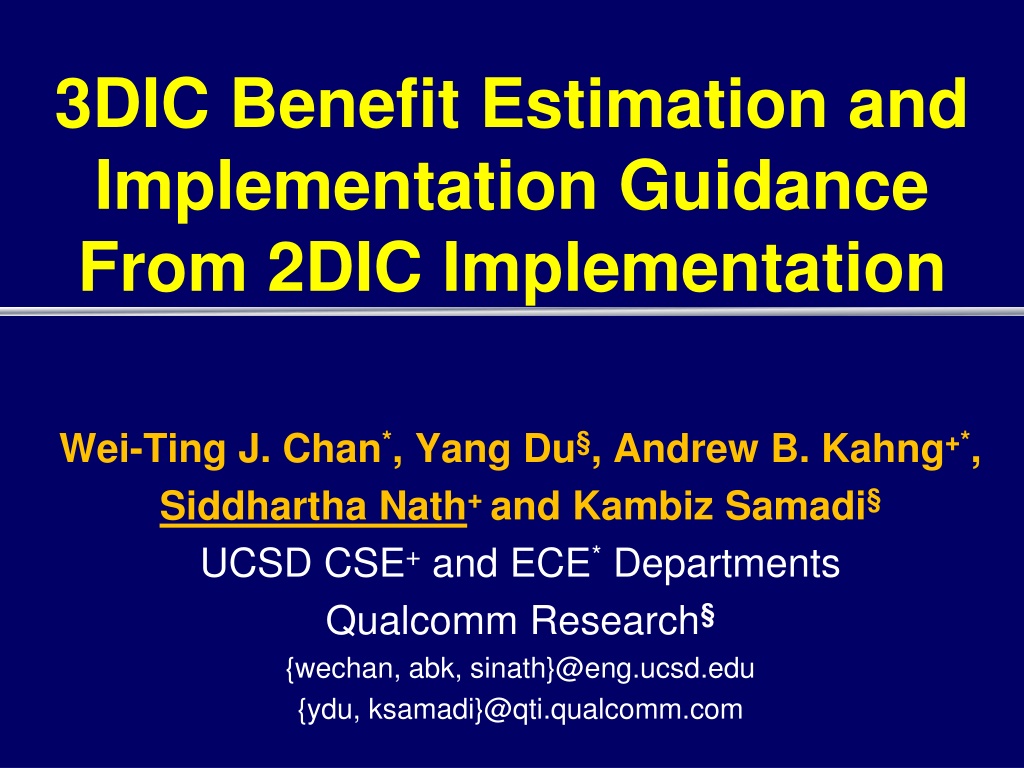
3DIC Benefit Estimation and Implementation Guidance From 2DIC Implementation Wei-Ting J. Chan*, Yang Du , Andrew B. Kahng+*, Siddhartha Nath+and Kambiz Samadi UCSD CSE+and ECE*Departments Qualcomm Research {wechan, abk, sinath}@eng.ucsd.edu {ydu, ksamadi}@qti.qualcomm.com
Outline Introduction Upper Bound on 3D Wirelength Benefit Modeling Methodology Results Summary 2
3DIC Value Proposition Continue Moore s Law trajectory of value scaling Fundamental to More Than Moore idea Power reduction benefit is the key value proposition Implementation-Space Exploration (ISE) requires 3D power estimation tools 3
3D Power Estimation Challenges 3D benefit varies with netlist topologies, constraints, etc. Implementation space is high-dimensional Constraints, layout contexts EDA tool flows Technology choices No golden 3D implementation flows with commercial EDA tools Chicken-and-egg loop: Trying to embed netlists not created for 3D into 3D No tool to predict 3D power benefit from 2D implementations Need a fast and accurate 3D power estimation tool 4
Shrunk2D ? ?/ 2 True 3D Flow ?/ 2 ? Vertical interconnects 3DIC 2DIC 2D P&R on one (shrunk) die (?/ 2, ?/ 2) Shrunk cell sizes in LEF Partition post-P&R netlist into two dies Shrunk2D Flow [1] (= best 3D today) 5 [1] Panth et al., Design and CAD Methodologies for Low Power Gate-Level Monolithic 3D ICs , Proc. ISLPED, 2014, pp. 171-176.
Our Contributions Tight upper bound on the WL reduction of 3D integration First to develop 3D power benefit estimation (3DPE) tool based on 2D implementations 3DPE predicts the 3D power benefit (i.e., 2D-3D delta ) to within 5% error Model parameter selection based on sensitivity of SP&R outcomes to WLM, RC scaling Model validations using stress tests Application of 3DPE in model-guided implementation 6
Outline Introduction Upper Bound on 3D Wirelength Benefit Modeling Methodology Results Summary 7
Upper Bound on 3DIC WL Reduction X X n1 n1 C D C D B A B A Y Y Z Given any optimal 3D placement Each 3D edge length grows by at most twice its length when embedded into 2D E.g., if sum of edge lengths in 3D = k, then sum of edge lengths 3k in the 2D placement Benefit (3 1) / 3 x 100 = 66.7% 8
Upper Bound is Tight X X n1 n1 C D C D B A B A Y Y Z WLOG, the graph can be stretched in one direction (i.e., X or Y) This three-pin net example shows that the upper bound on 3D WL reduction is tight Maximum 3D Wirelength Benefit = (3 1) / 3 x 100 = 66.7% 9
Outline Introduction Upper Bound on 3D Wirelength Benefit Modeling Methodology Results Summary 10
Testcases Wide range of IPs / building blocks of SoCs Technology: 28nm foundry FDSOI Testcase Type Testcase Name # Instances (post-synthesis) 212K 347K 98K 12K 10K Min Clock Period when TNS = 0 1.6ns 1.6ns 1.0ns 1.0ns 0.9ns GPU CPU Modem Multimedia Peripheral Engine THEIA OST2 (spc) Viterbi DCT AES 11
Implementation-Space Parameters Constraints Clock period Max transition time Max capacitance, fanout Max clock skew, latency, transition time PVT corners Layout context Aspect ratio Utilization Technology WLM, RC scaling Libraries, Vt flavors 12
Flow and Top-10 Parameters Engineered, Default WLM Timing Library / SDC Logic Synthesis P&R(2D and S2D) (S2D) P&R Scaled Cap Tables P&R (2D and S2D) (2D) Training data Design Parameter & QoR Collection Learning-based Modeling Constraints (6): Clock period, max transition, max fanout, max clock skew, max clock latency, max clock transition Layout context (2): AR, utilization, Technology (2): WLM/RC scaling, multi-Vt libraries 13
Machine Learning Methodology Parameters from 2DIC (post-P&R) Parameters from synthesis w/ WLMs ANN 1 input, 1 output, 2 hidden layers Start with #epochs = 1000; #neurons = 1 Force bounded error Actual % Power (ground truth) (2D S2D) Training and Validation phase Increase (#epochs, #neurons) by (500, 1); penalty on outliers by 1000 Error range < Threshold? Save model and exit 14
Outline Introduction Upper Bound on 3D Wirelength Benefit Modeling Methodology Results Summary 15
High-Quality Estimate of Power 4.80% -4.71% Worst-Case Error ~5% Example: Pwr2D = 90mW, Pwr3D= 80mw, = 10mW 10% error on actual prediction range is 72mW to 88mW 10% error on prediction range is 79mW to 81mW 16
Model Validations No ground truth from 3DIC implementations Test: Can 3DPE models return unlikely predictions? Model indicates up to 39% benefit for data points that may be practically realizable 17
Model-Guided Implementation Actual 3D Power Predicted 3D Power 23 S2D (default) 22.8 22.6 22.4 Wbest, model Power (mW) 22.2 22 Wbest, actual 21.8 21.6 1.35mW (6.43%) 21.4 21.2 0.34mW (1.62%) 21 20.8 0 0.2 0.4 0.6 0.8 1 1.2 WLM Cap (pF) Hypothesis: 3DPE should guide implementation if predictions are reliable 3D power from 3DPE model guidance is better than default S2D by 5% 18
Outline Introduction Upper Bound on 3D Wirelength Benefit Modeling Methodology Results Summary 19
Summary Power reduction is a value proposition for 3DICs Lack of a golden 3D flow makes 3DIC benefit prediction a difficult problem We develop 3DPE tool with machine learning techniques Predicts % power benefit to within 5% error We propose stress testing and model-guided implementation approaches with 3DPE Ongoing Extending 3DPE from block-level to SoC-level Developing a true 3D flow 20
Acknowledgments Prof. Alex Zelikovsky of Georgia State University Prof. S. K. Lim, Shreepad Panth and Moongon Jung of Georgia Tech Qualcomm Research 21
Summary Power reduction is a value proposition for 3DICs Lack of a golden 3D flow makes 3DIC benefit prediction a difficult problem We develop 3DPE tool with machine learning techniques Predicts % power benefit to within 5% error We propose stress testing and model-guided implementation approaches with 3DPE Ongoing Extending 3DPE from block-level to SoC-level Developing a true 3D flow Thank You! 22
BACKUP 23
Error Distribution Narrow distribution Few outliers 24


