Enhancing State Capacity for Data Utilization in Education Evaluation
Explore the process of drafting an evaluation blueprint to build state capacity for accurate data collection, reporting, and utilization in education. The discussion covers IDC evaluation approaches, qualitative methodologies, state perspectives on capacity building, and initial feedback. Kentucky's vision emphasizes building capacity at the SEA and local levels, documenting data processes, fostering communication, creating agency ownership, and promoting a culture of high-quality data.
Download Presentation

Please find below an Image/Link to download the presentation.
The content on the website is provided AS IS for your information and personal use only. It may not be sold, licensed, or shared on other websites without obtaining consent from the author.If you encounter any issues during the download, it is possible that the publisher has removed the file from their server.
You are allowed to download the files provided on this website for personal or commercial use, subject to the condition that they are used lawfully. All files are the property of their respective owners.
The content on the website is provided AS IS for your information and personal use only. It may not be sold, licensed, or shared on other websites without obtaining consent from the author.
E N D
Presentation Transcript
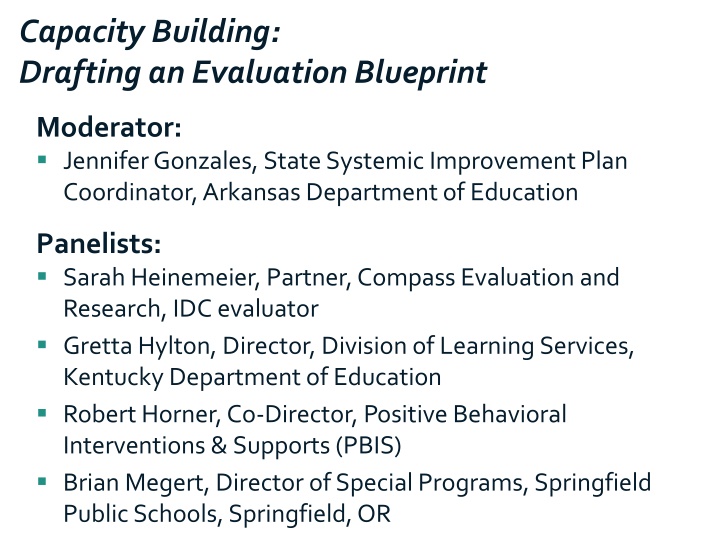
Capacity Building: Drafting an Evaluation Blueprint Moderator: Jennifer Gonzales, State Systemic Improvement Plan Coordinator, Arkansas Department of Education Panelists: Sarah Heinemeier, Partner, Compass Evaluation and Research, IDC evaluator Gretta Hylton, Director, Division of Learning Services, Kentucky Department of Education Robert Horner, Co-Director, Positive Behavioral Interventions & Supports (PBIS) Brian Megert, Director of Special Programs, Springfield Public Schools, Springfield, OR 1
Capacity Building: Drafting an Evaluation Blueprint OSEP PROJECT DIRECTORS CONFERENCE AUGUST 1-3, 2016 Sarah Heinemeier Gretta Hylton IDC Formative Evaluation Team Member State Special Education Director Compass Evaluation & Research Kentucky Department of Education
Purpose Describe project Build state capacity to accurately collect, report, and use IDEA data Describe IDC evaluation approach Explore qualitative methodology used in the evaluation Describe state perspectives on capacity building Provide initial feedback and results 3
IDC Logic Model See handout 4
Kentucky Department of Education Staff changes within the past year: Commissioner State Director of Special Education Special Education Branch Manager IDEA Financial Analyst Staff changes within the past three years: Three Part B Data Managers Three Associate Commissioners 5
Kentuckys Vision Build capacity at the SEA Build capacity within local school districts Document data processes Open lines of communication across divisions Create agency ownership for the data Identify needed changes/modifications to processes Create a culture of high-quality data 6
Kentuckys Vision (cont.) Leverage Priority of the Commissioner, Associate Commissioner, Director Accurate data for improved decision making Confidence in data being used for a purpose Support from IDC in the form of data specialist, TA specialist, meeting recorder, and facilitator 7
Kentuckys Vision (cont.) Barriers High turnover rates among SEA leadership, program staff, and data managers Lack of institutional knowledge and experience Organizational structure of SEA Time 8
Intensive TA in Kentucky Pilot for IDC s IDEA Part B Data Processes Toolkit Child Count and Educational Environments Exiting Discipline MOE/CEIS Dispute Resolution Personnel Assessment 9
Intensive TA in Kentucky (cont.) Monthly onsite support from IDC State Liaison Data process mapping Protocol development Privacy and confidentiality training Facilitation of meetings with various offices within the SEA 10
Intensive TA in Kentucky (cont.) Monthly calls with division leadership, program staff, and data manager State-driven conversations FAQs Troubleshooting 11
Evaluating Intensive TA Formative evaluation strategies for gathering information about the effectiveness of IDC intensive TA efforts Document review Regular communication with IDC State Liaison Observations of TA work Interviews with state staff 12
Evaluating Intensive TA (cont.) Document review Service-related documents such as TA plan, logic model, meeting minutes Products produced through TA Regular communication with IDC State Liaison Contextual information Perspective on the past months activities Successes, challenges, and barriers Upcoming activities 13
Evaluating Intensive TA (cont.) Observations of TA work (on-site, calls) Rich contextual information State participation IDC team engagement Alignment of work with TA goals TA strategies 14
Evaluating Intensive TA (cont.) Interviews with state staff State perspective on TA Better understanding of individual capacity building Better understanding of barriers and challenges Feedback on the alignment of TA with organizational culture and expectations 15
Making Sense of the Data Key Formative Questions Do results align with our theory of change? Are the barriers and challenges what we expected? Is the level of progress what we expected? Bottom Line Short and intermediate term: Has the capacity of Kentucky to collect, report, and use high-quality IDEA data improved? According to whom? OSEP, IDC TA team, Kentucky? Long-term: Does Kentucky have higher-quality IDEA data? 16
Making Sense of the Data (cont.) Analytic Tools: IDC Intensive TA Quality Rubric Developed by the IDC Evaluation Team Four domains Clarity (state commitment, discovery, and planning) Integrity (faithfulness of implementation) Intensity (frequency, type, and duration) Accountability (outputs and outcomes) NEW: Management of the TA effort 17
Benefits of TA in Kentucky Emphasis on systems thinking with a problem- solving approach Development of consistent, clear process requirements for the collection and reporting of data Documentation of clearly defined roles, responsibilities, and expectations for all staff Creation of a collaborative culture Increased attention on continuous improvement 18
Benefits of TA in Kentucky (cont.) Increased confidence among staff Accurate data used to make decisions Partners and shareholders have more confidence in the data More reflection and conversations around the data Less loss of institutional knowledge Data being used for a purpose 19
Using Data to Improve Services Feedback to IDC State Liaisons and Part B/C TA Leads Example: observations about the interactions of IDC TA staff with each other Example: observations about the adherence of IDC staff to the TA plan Refining plans with the state Example: pilot testing the use of a standard protocol for developing data-quality guidelines 20
Lessons Learned Better understanding from evaluation standpoint as to what makes TA effective TA must serve two agendas: state s needs and OSEP s needs. Management is important. Importance of contextual information Observations and conversations have been critical. 21
For More Information Visit the IDC website http://ideadata.org/ Follow us on Twitter https://twitter.com/ideadatacenter 22
The contents of this presentation were developed under a grant from the U.S. Department of Education, #H373Y130002. However, the contents do not necessarily represent the policy of the Department of Education, and you should not assume endorsement by the Federal Government. Project Officers: Richelle Davis and Meredith Miceli Project Officers: Richelle Davis and Meredith Miceli 23
