Enhanced Flow Estimates in NHDPlus Version 02 Presentation
Presentation by Tim Bondelid at the ESRI International User Conference discussing the Enhanced Runoff Method (EROM) in NHDPlus Version 02 for improved stream flow estimates. Highlights the importance of accurate flow estimates for various water-related goals and the methodology used to enhance flow estimation in the current V02 release. Includes step-by-step process and QA module statistics.
Download Presentation

Please find below an Image/Link to download the presentation.
The content on the website is provided AS IS for your information and personal use only. It may not be sold, licensed, or shared on other websites without obtaining consent from the author.If you encounter any issues during the download, it is possible that the publisher has removed the file from their server.
You are allowed to download the files provided on this website for personal or commercial use, subject to the condition that they are used lawfully. All files are the property of their respective owners.
The content on the website is provided AS IS for your information and personal use only. It may not be sold, licensed, or shared on other websites without obtaining consent from the author.
E N D
Presentation Transcript
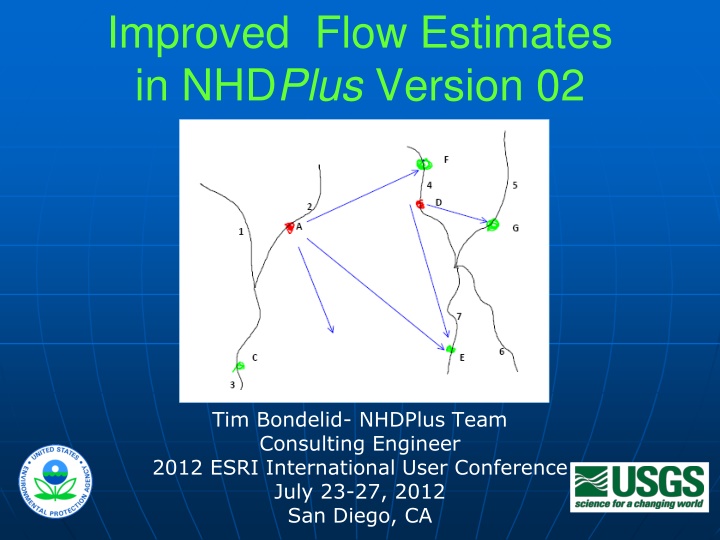
Improved Flow Estimates in NHDPlus Version 02 Tim Bondelid- NHDPlus Team Consulting Engineer 2012 ESRI International User Conference July 23-27, 2012 San Diego, CA 1
NHDPlus V02 Enhanced Runoff Method (EROM) Contributors: The NHDPlus Team EROM: Dave Wolock, USGS Kernell Ries, USGS Greg Schwarz, USGS 2
Importance of Stream Flow Estimates Support the water element goals expressed in the EPA Strategic Plan Support the water mission of the USGS Water-quality modeling (SPARROW) Regional and national stream flow assessments goal of National Stream Flow Information Program National Water Census Watershed planning and management 3
NHDPlusVersion 02 Flow Estimation Enhanced Runoff Method (EROM) Mean annual and mean monthly flow estimates Current V02 release is mean annual flow Significantly improved ingredient data Five-step process Each step incrementally improves the flow estimates Flow QA module; statistics on performance 4
5 U.S.: Wolock and McCabe; CN and MX: Canadian Forest Service
Step 1: Runoff (SR) 100,000 10,000 EROM Flow (cfs) 1,000 100 10 1 1 10 100 1,000 10,000 100,000 Gage Flow (cfs) QA Statistics Gage Runoff EET Ref Reg. PlusFlow Gage Seq. Mean Mean SEE Mean SEE Mean SEE Mean SEE SEE 2.36 2.17 58.8 2.17 58.8 2.37 32.6 2.37 32.6 23.0 6
Step 2: Excess Evapotranspiration (EET) Colorado River (Southwestern U.S.) Non-conservative routing model Conservative routing model Measured flow 30000 25000 Streamflow (cfs) 20000 15000 10000 5000 0 0 100000 200000 300000 400000 500000 600000 700000 Drainage basin area (km2) Method developed by Dave Wolock of USGS. (graphic courtesy of Dave Wolock) 7 7
Step 2: EET (10L) 100,000 90,000 80,000 70,000 60,000 EROM Flow (cfs) 50,000 40,000 30,000 20,000 10,000 0 0 10,000 20,000 30,000 40,000 50,000 60,000 70,000 80,000 90,000 100,000 Gage Flow (cfs) QA Statistics Gage Runoff EET Ref Reg. PlusFlow Gage Seq. Mean Mean SEE Mean SEE Mean SEE Mean SEE SEE 2.35 2.46 118.7 2.30 90.6 2.37 32.6 2.37 32.6 23.0 8
Step 1: Runoff (SR) 100,000 10,000 EROM Flow (cfs) 1,000 100 10 1 1 10 100 1,000 10,000 100,000 Gage Flow (cfs) QA Statistics Gage Runoff EET Ref Reg. PlusFlow Gage Seq. Mean Mean SEE Mean SEE Mean SEE Mean SEE SEE 2.36 2.17 58.8 2.17 58.8 2.37 32.6 2.37 32.6 23.0 9
Step 3: Reference Gage Regression (SR) 100,000 10,000 EROM Flow (cfs) 1,000 100 10 1 1 10 100 1,000 10,000 100,000 Gage Flow (cfs) QA Statistics Gage Runoff EET Ref Reg. PlusFlow Gage Seq. Mean Mean SEE Mean SEE Mean SEE Mean SEE SEE 2.36 2.17 58.8 2.17 58.8 2.37 32.6 2.37 32.6 23.0 10
Step 4: Transfer, Withdraw, Augment Flows ( PlusFlowAR ) 2 .3 .3 2 1 6 4 Transfer 2 cfs 7 .5 9 2.5 .5 10 8 12 11
Step 4: PlusFlowAR (NE) 100,000 10,000 EROM Flow (cfs) 1,000 100 10 1 1 10 100 1,000 10,000 100,000 Gage Flow (cfs) QA Statistics Gage Runoff EET Ref Reg. PlusFlow Gage Seq. Mean Mean SEE Mean SEE Mean SEE Mean SEE SEE 2.42 2.40 14.9 2.40 14.9 2.43 14.7 2.43 11.7 10.9 12
Step 5: Gage Adjustment 2 .3 .3 2 Flowline adjustments closest to the gage will get higher weights than Flowlines farther from the gage 1 6 .5 9 .5 10 Gage DA = 12 Gage Q = 13 EROM Flow = 12 QAdj = 13 12 = 1 12 13
Gage Adjustment: Re-Accumulated Flows 2 .3 .3 2 1 6.16 .5 9.40 .5 10.67 Gage DA = 12 Gage Q = 13 Flowline Flow = 12 QAdj = 13 12 = 1 13 14
Gage Adjustment QA: Randomly remove 20% of the gages from the gage adjustment Called Gage Sequestration Provides a ballpark estimate of how well the final, gage-adjusted flows match gage flows QA Statistics Gage Runoff EET Ref Reg. PlusFlow Gage Seq. Mean Mean SEE Mean SEE Mean SEE Mean SEE SEE 2.36 2.17 58.8 2.17 58.8 2.37 32.6 15 2.37 32.6 23.0
EROM Next Steps We are always looking for ways to improve EROM Reference Gage Regression; issue with cases where it over-adjusts at higher flows Increase the number of gages; the more valid gages the better! Update to a more recent version of Reference Gages; GAGESII ? Adjust flows further upstream? Monthly flows 16
Down the Road PlusFlowAR: Incorporate more detailed information from NHD Stewards, WBD, others! Seasonal values? EET Step: Model Coefficients, issues in some areas Other flows: 7Q10 Use a 1981-2010 time frame PRISM has released normals for this period The major issue: international drainage 17
Questions? Tim Bondelid - Independent Consultant to EPA timothy@trbondelid.com NHDPlus V02: http://www.horizon-systems.com/NHDPlus 18
