Ecological Pyramids: Models of Trophic Relationships
Ecological pyramids are graphical models that depict quantitative differences between trophic levels in an ecosystem. They come in three types: Pyramids of Numbers, Pyramids of Biomass, and Pyramids of Productivity/Energy. Pyramids of Numbers show the number of organisms at each trophic level, Pyramids of Biomass represent the amount of dried tissue at each level, and Pyramids of Productivity/Energy demonstrate the loss of energy as it moves up trophic levels. These pyramids provide valuable insights into ecosystem dynamics and energy flow.

Download Presentation

Please find below an Image/Link to download the presentation.
The content on the website is provided AS IS for your information and personal use only. It may not be sold, licensed, or shared on other websites without obtaining consent from the author.If you encounter any issues during the download, it is possible that the publisher has removed the file from their server.
You are allowed to download the files provided on this website for personal or commercial use, subject to the condition that they are used lawfully. All files are the property of their respective owners.
The content on the website is provided AS IS for your information and personal use only. It may not be sold, licensed, or shared on other websites without obtaining consent from the author.
E N D
Presentation Transcript
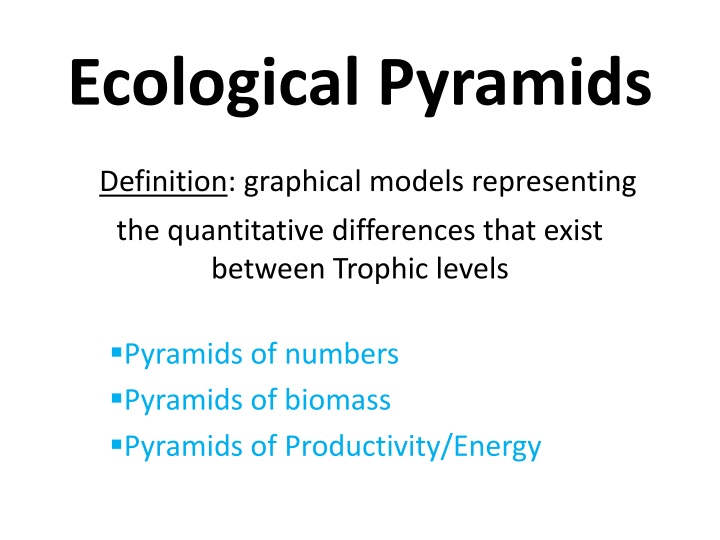
Ecological Pyramids Definition: graphical models representing the quantitative differences that exist between Trophic levels Pyramids of numbers Pyramids of biomass Pyramids of Productivity/Energy
Pyramids of Numbers 3rdlevel consumer Basic pyramid represents the number of organisms at each trophic level. Can display different patterns depending on the type of ecosystem represented. Large lower level organisms = smaller numbers at that level. No equation given 500 2ndlevel consumers 10,000 1stlevel consumers 50,000 Producers 100,00 individuals 1 Owl 100 bugs, squirrels, birds 1 Tree
Pyramids of Biomass Represents the amount of dried tissue at each trophic level. Quantities of biomass and energy decrease along the food chain(hence: pyramid shape) Equation: gms/meters or Joules/meters (energy)
Pyramids of Productivity/Energy Equation: (B - B )/ Time (t) = NP Normal pyramid shows the loss of energy in comparison with the movement up the Trophic levels. Each step will be 10% the size of the previous step The exception to the normal pyramid is when portions of a food web are supported by inputs of resources from outside of the local community. Ex: global warming = increase in solar energy Ex: addition/subtraction of non- native species to an environment.